My Performance Ranking divergence method looks for sector relative charts with divergences on the 14 week RSI and the sector Performance Rank (PR).
An example I’ve been monitoring for a while is PPG Industries (PPG) versus the SPDR Materials (XLB).
The PR shows how PPG ranks on price performance against every other component of XLB over a weighted average of time periods.
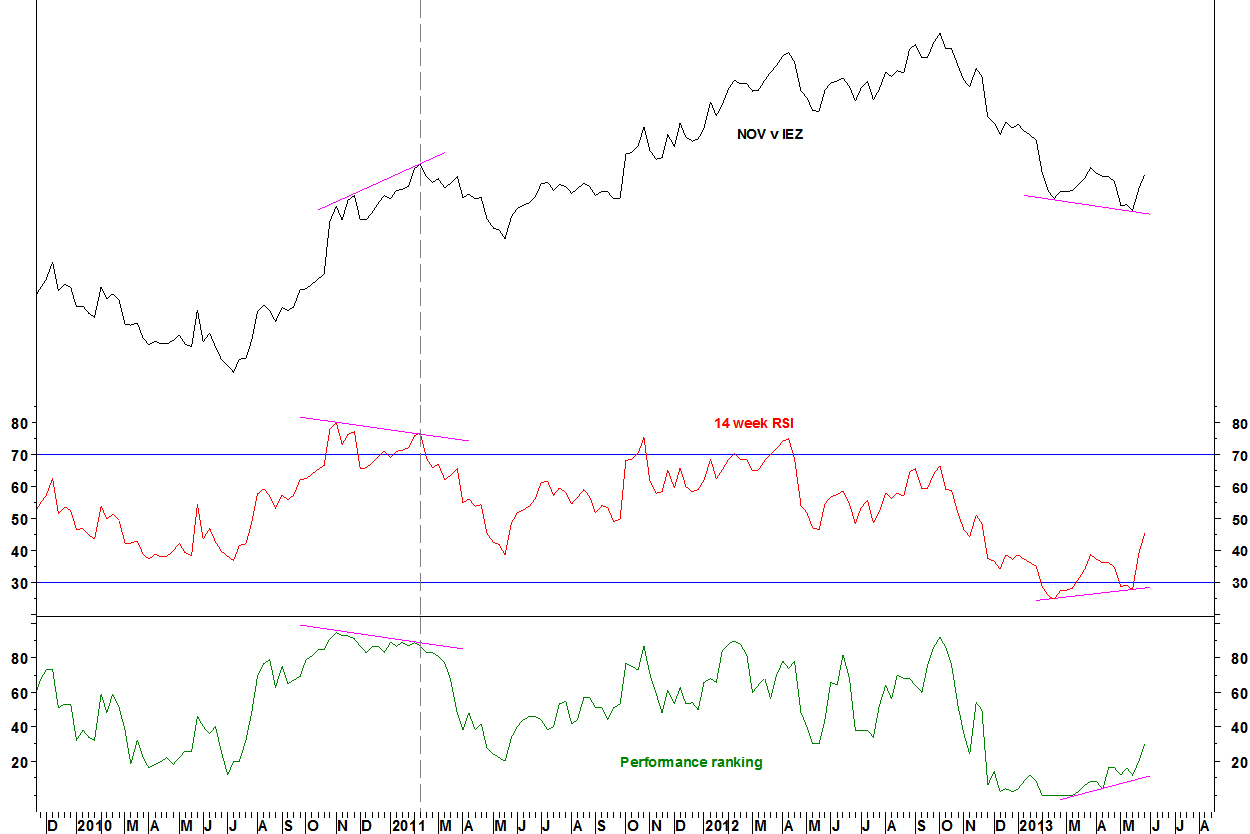
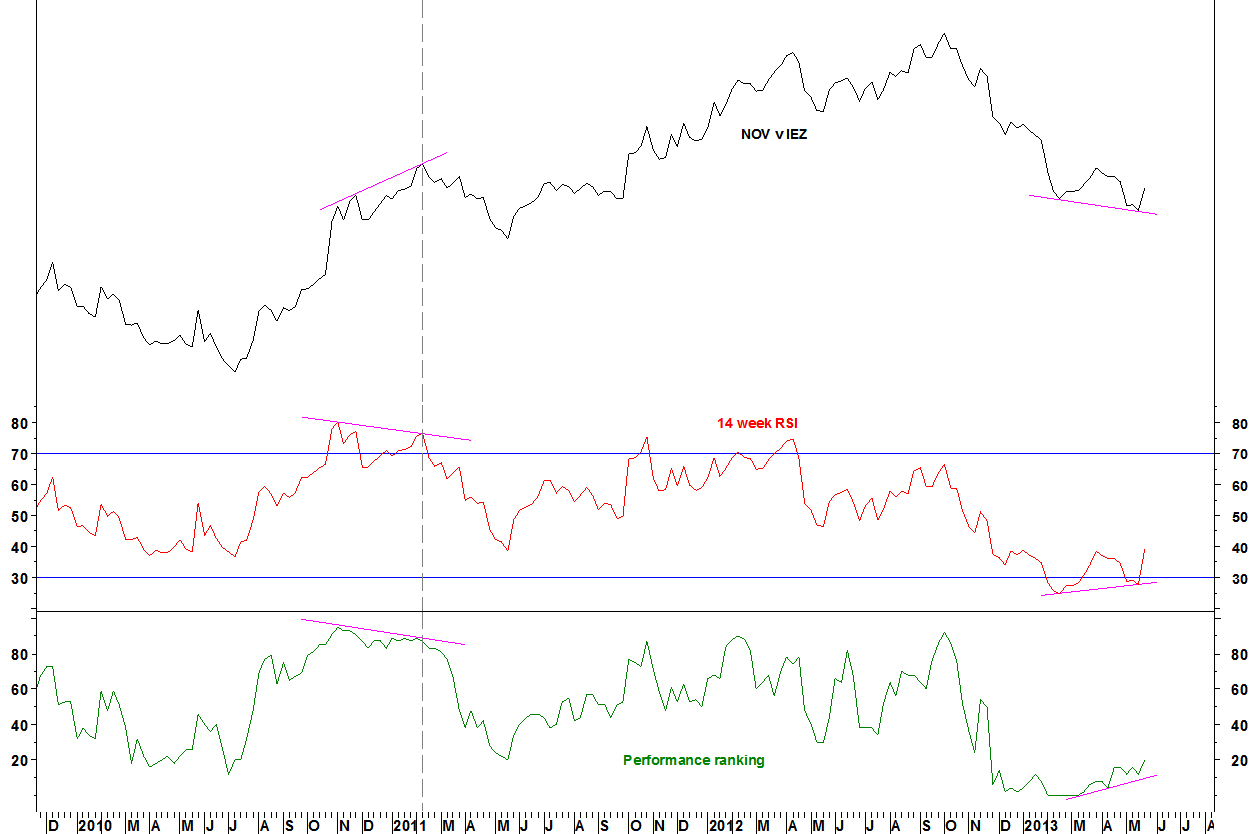
PPG Industries (PPG) versus SPDR Materials (XLB)
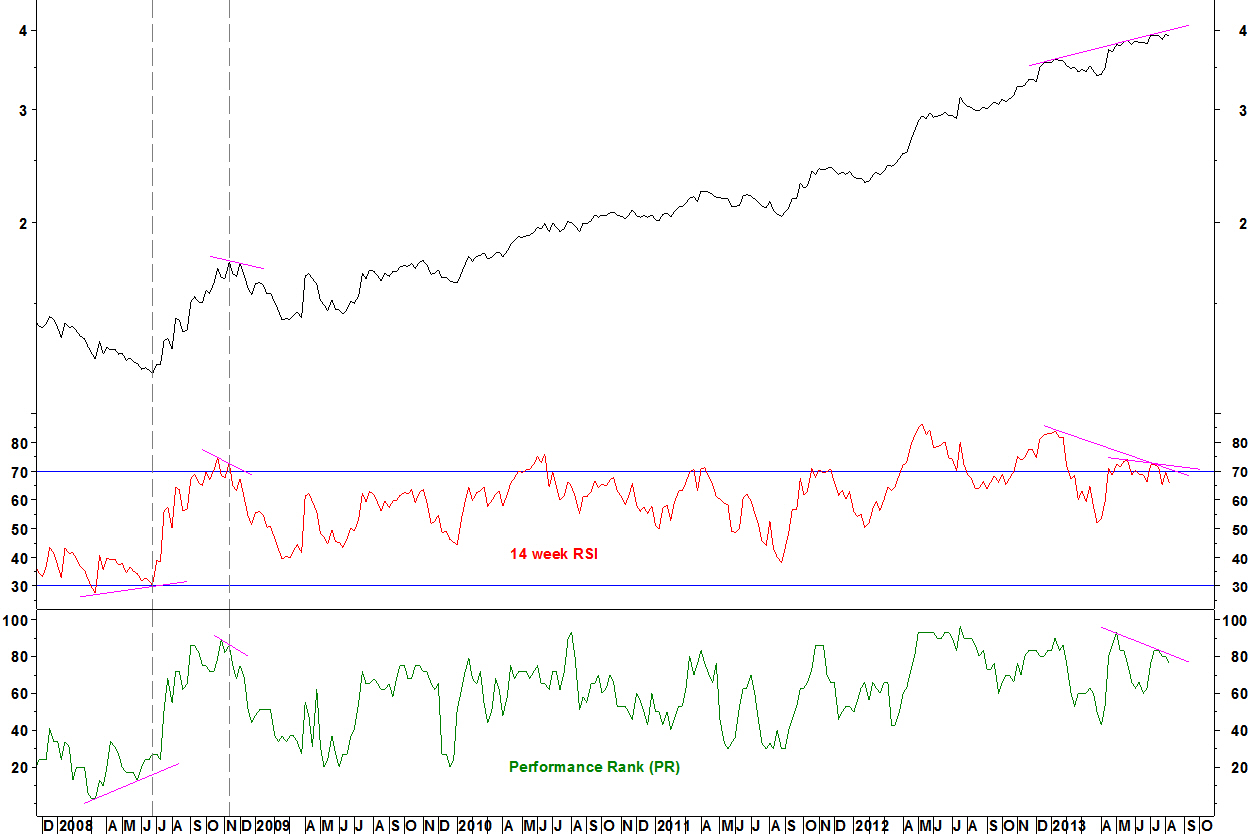
- In June 2008, the low for PPG versus XLB is formed with a bullish divergence on the PR. The RSI is also higher than in March 2008, slightly above 30
- In November 2008, the high in formed with short term bearish divergences on the PR and RSI
- Now, the relative high forms with a bearish divergence on the PR against May 2013
- Also, the RSI has bearish divergence against January and May 2013
Daily chart
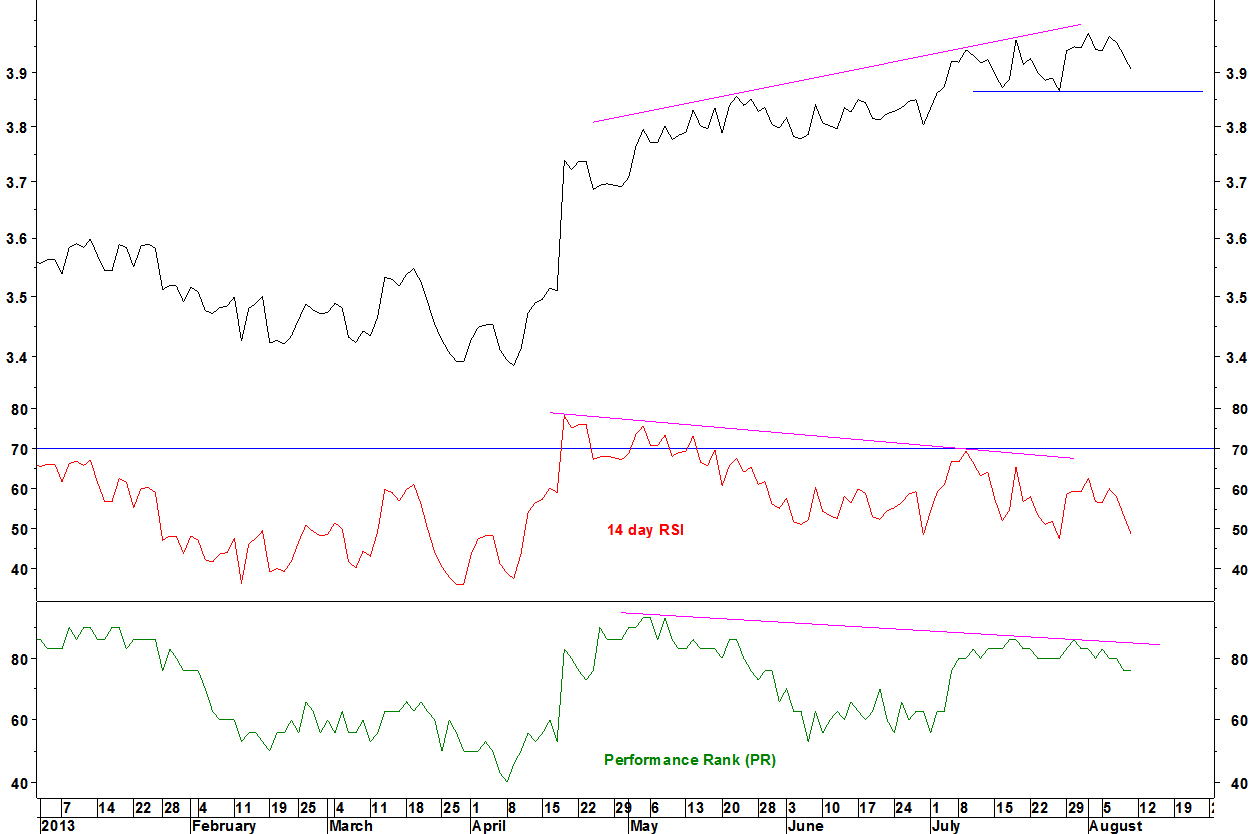
- The RSI formed divergence since April, first above 70 and now below 70, matching my RSI divergence criteria
- The PR divergence is shown. Also it has made a low since early July
The weekly RSI has already broken below the intervening low since the May high (the low since the January high is much lower). A move below the low of 26 July of 3.86565 will be a new low since early July.
That will be taken as the signal to open a short position in this pair. The stop loss will be a new high, which is above 3.97597 from 01 August, 2.9% higher.
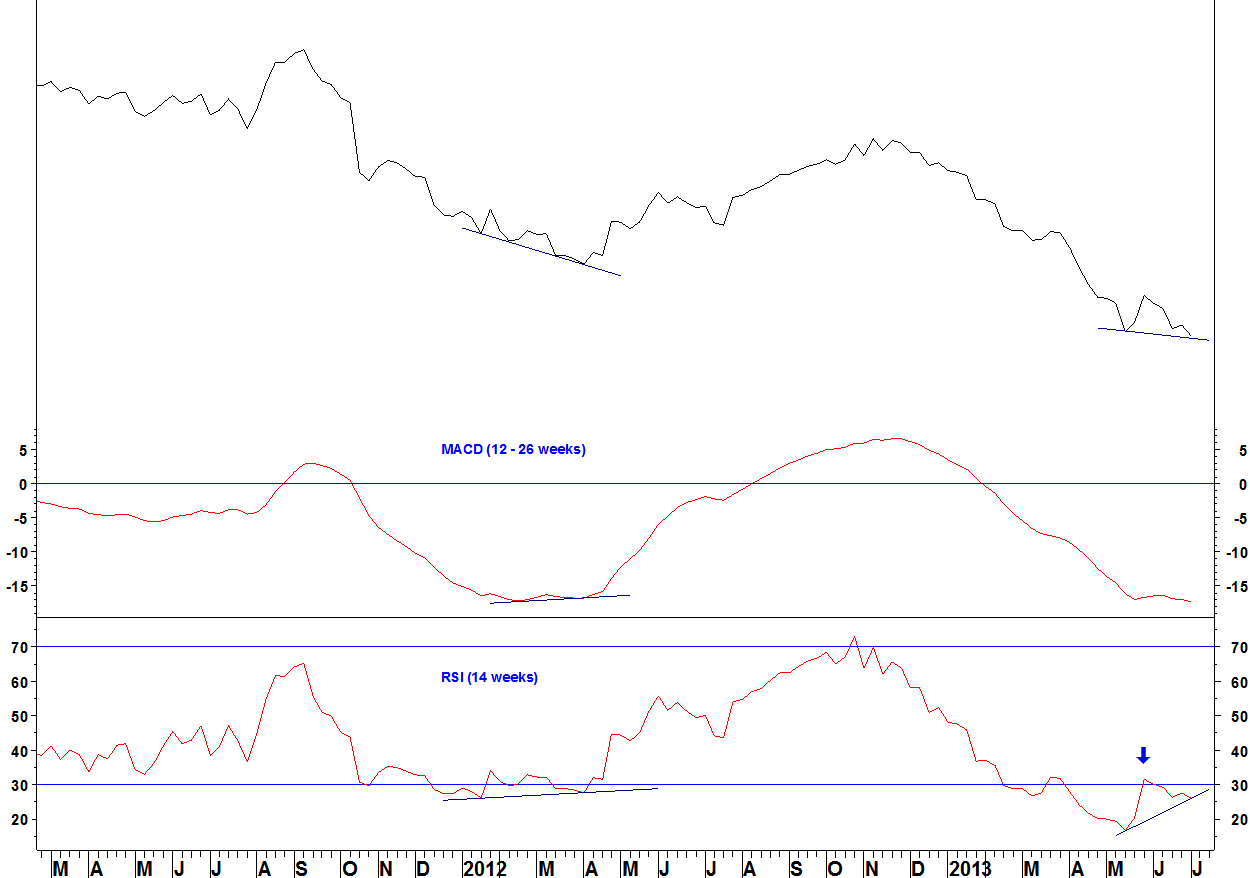
My RSI divergence method looks for weekly divergences on the 14 week RSI. The SPDR Dow Jones Industrial Average (DIA) now has this.
SPDR Dow Jones Industrial Average (DIA)
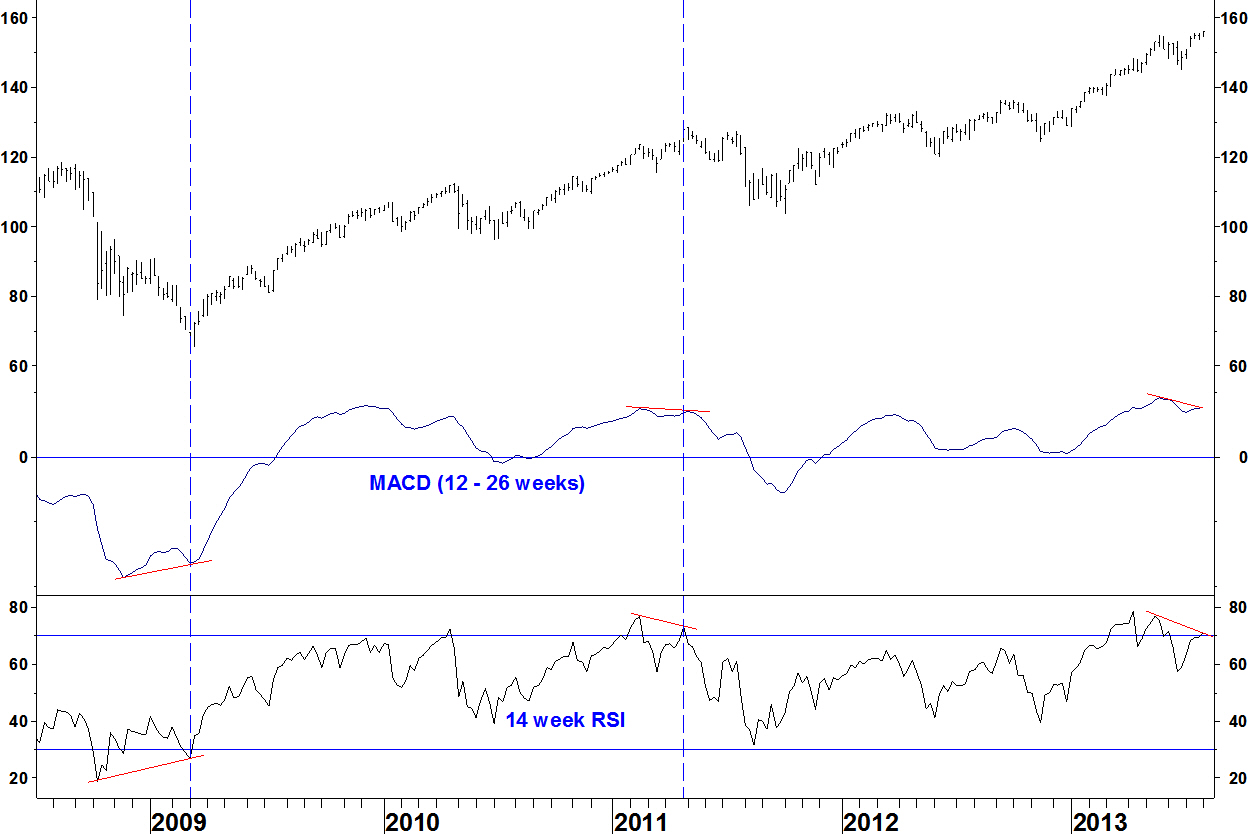
- There are weekly RSI and MACD divergences against the May high
- The May 2011 high was formed with the same divergences.
- The March 2009 low was formed with bullish divergences for these indicators
Expect the index to move lower in the next few months but note that the sell off from the April 2011 high came in two stages and most of it within a two week period in early August. These divergence sometimes mark long term turning points, as in 2009 but not always, as in 2011. The S&P500 Index also has this divergence, whereas the small cap and NASDAQ indices do not.
Daily chart

There is a bearish divergence against the May high but not an exact match to my criteria on the daily charts for RSI divergence trades. I will look for examples that match the criteria exactly.
A move below the intervening weekly RSI low of 65.98 from 14 June would be a sell signal. Alternatively, a weekly reversal bar could be taken, which would be less certain but have a tighter stop loss.
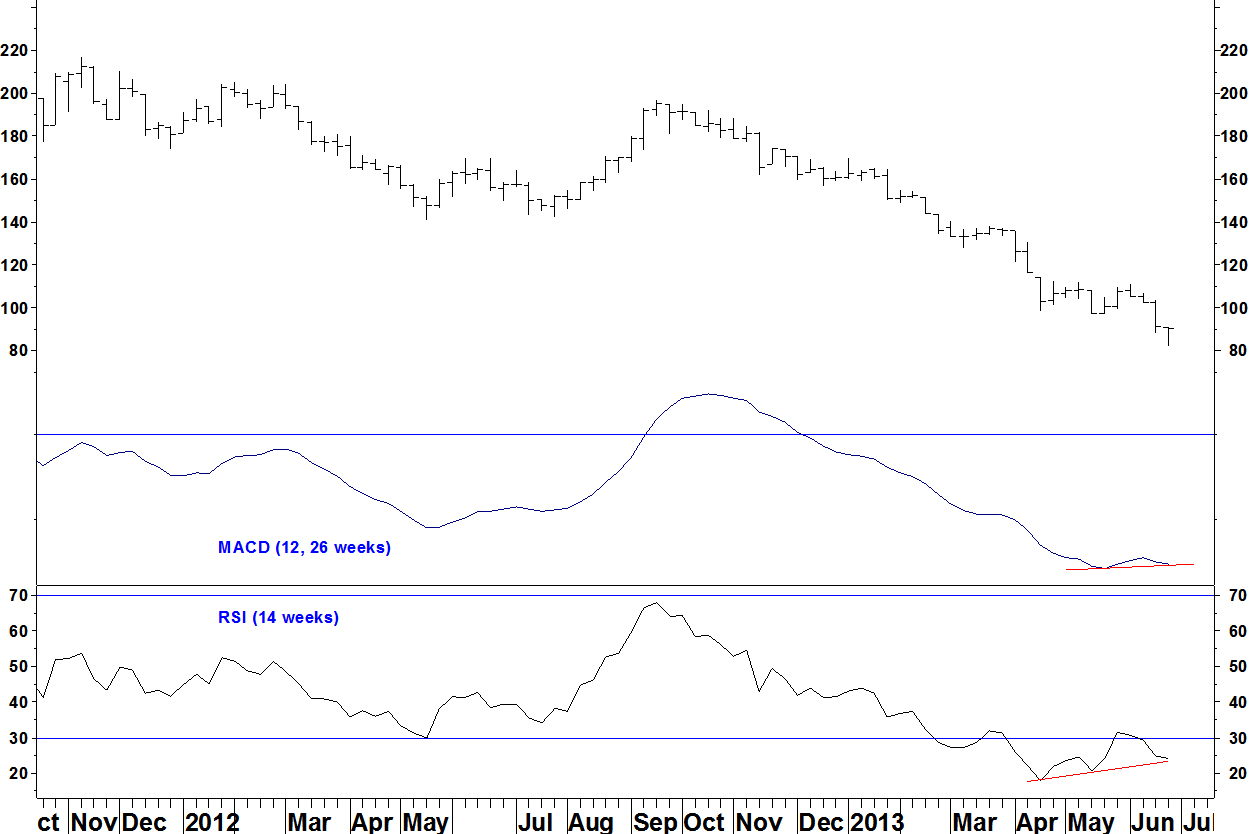
Gold
The position in the Philadelphia Gold & Silver Index (XAU) has moved back into a slight loss, although nothing has changed on the weekly chart, the stop loss of a new low remains in place. The pair involving Agnico Eagle Mines (AEM) has not met its entry criteria.
On 01 July, I showed the set up for an RSI divergence buy signal on the Philadelphia Gold & Silver Index (XAU). The buy signal, a weekly RSI close above 31.64 from late May was given on the week ending 19 July.
A long position was opened at 94.82, with a stop loss at a new closing low (below 82.29 from 26 June). The position gained 6.4% in its first week.
Philadelphia Gold & Silver Index (XAU)
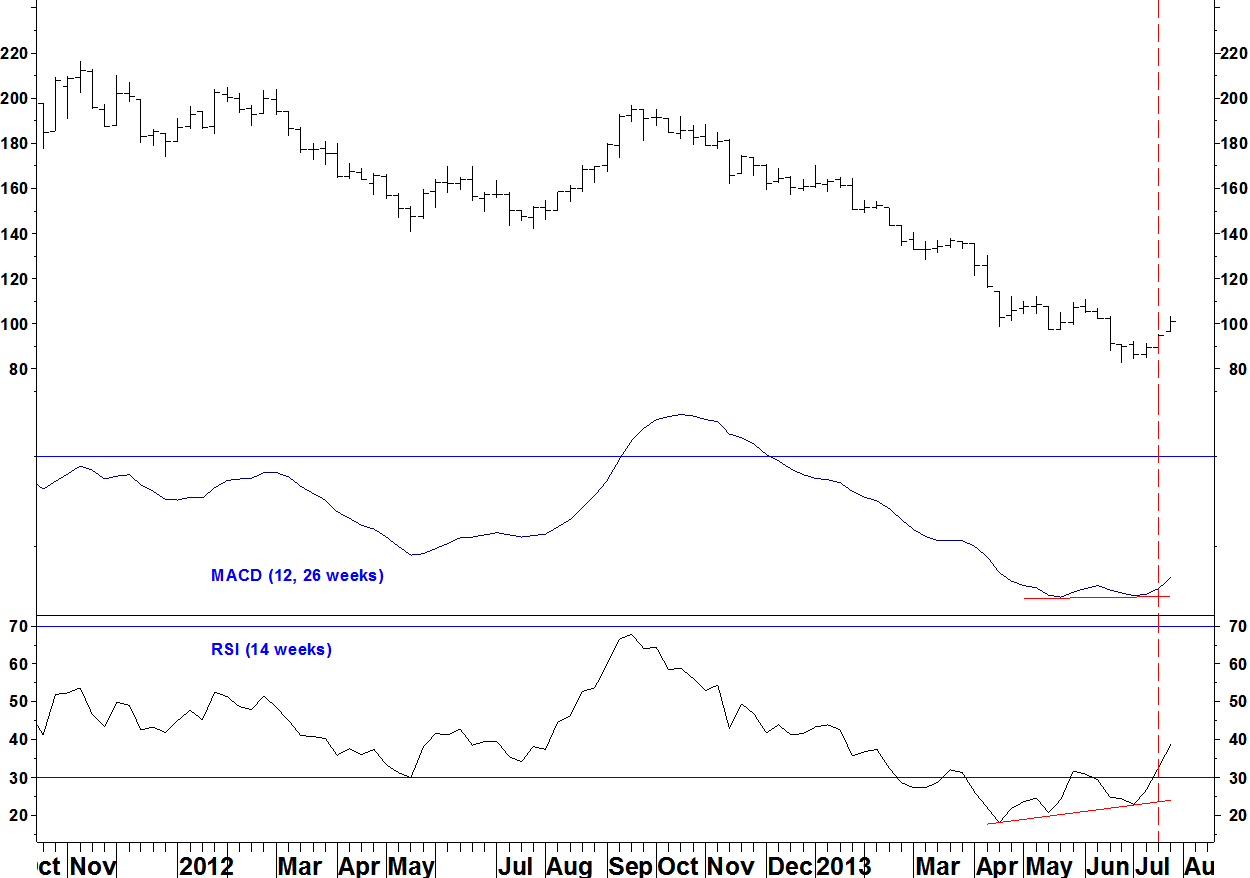
Although the daily RSI did not set up exactly as stated in my ideal criteria, there was a divergence. The MACD has gone positive for the first time since 01 November 2012.
Daily chart

Pairs positions versus S&P 500 Index
On 08 July, a pair of Agnico Eagle Mines (AEM) v S&P 500 Index was shown. This has still not given its entry signal of the weekly RSI breaking its late May high.
Goldcorp (US:GOLD) vs S&P 500 Index also met the entry criteria. It gave a weekly RSI entry signal on Friday 26 July. The stop loss to a new low is larger than for AEM though (19.5% vs 13.6%) and AEM has a tidier daily chart, in that a weekly entry signal will likely be a move to a new relative high since 01 July (blue arrow). Therefore I will stick to that as a pair, should it be triggered.
AEM v S&P 500 Index
The National Oilwell Varco (NOV) v iShares Dow Jones US Oil Equipment Index (IEZ) position that was opened on 24 May has traded sideways. NOV is the worst performer in the sector today, so I’m going to close the position with NOV at $72.27 and IEZ at $59.89, giving a profit of 1.4%.
Whilst I got the move off the divergent low, there has been no follow through. Some examples of these trades take a while to follow through but my aim is to show the best examples.
The gold trades that I described earlier in the month have not been triggered yet.
Last week I showed the Philadelphia Gold & Silver Index (XAU) forming a bullish divergence on its 14 week RSI. I set the entry criteria for a long trade as a weekly close of the RSI above the intervening peak of 31.64 from the week ending 31 May. This has yet to occur.
Philadelphia Gold & Silver Index (XAU)

The other approach is a pairs trade against the S&P500 Index. I had shown a potential bullish divergence setting up for Newmont Mining (NEM) earlier in the year but as was noted then, the daily RSI divergence criteria were not in place. Using my strict entry criteria in February/ March meant that I did not enter any wrong positions.
Now, there is better commonality about the gold stocks but still, NEM vs. SPX does not meet the daily RSI divergence entry criteria.
One pair that does meet the weekly and daily RSI entry criteria is Agnico Eagle Mines (AEM).
AEM v S&P 500 Index weekly chart
- The chart has a bullish weekly RSI divergence. There is no MACD divergence
- In spring 2012, there was RSI and MACD divergence
- There was a successful trade on AEM at the time, albeit against its sector index
AEM v S&P 500 Index daily chart
- Successive lows have had higher 14 day RSI values
- Now, the daily RSI is above 30, fitting the daily entry criteria
The entry criteria is a weekly close of the RSI above the intervening RSI high, in this case the RSI was 31.64 in week ending 31 May (blue arrow on weekly chart).
The Philadelphia Gold & Silver Index (XAU) has formed a bullish divergence on its 14 week RSI. There is also a slight MACD divergence.
The daily chart also has RSI and MACD divergences, although there isn’t an RSI above 30 as per the ideal entry criteria.

The last bullish weekly RSI divergence on this index that was formed within a single chart trough (as opposed to across troughs further apart), was in January 1998, so these are rare. The index rallied over 50% from that low but still went sideways for months after the initial low. The point is, these weekly RSI divergences don’t always bear fruit immediately.
I will open a long position on a weekly close of the RSI above the intervening peak of 31.64 from the week ending 31 May. The stop loss will be a close below the low of 82.29 from 26 June. You could use the Market Vectors Gold Miners (GDX) for this trade.
Two US bond ETFs are at 12 month lows and are nearing a moving average crossover. Depending on the instrument and the pair of moving averages, crossovers can happen regularly.
Moving average crossover methods use a cross of the shorter term average above the longer term average as a buy signal but in many markets, choppy ones especially, this can be a losing strategy.
The crossovers I’m interested in are when there has been no crossover for four years, making the next one more meaningful. See my methods page.
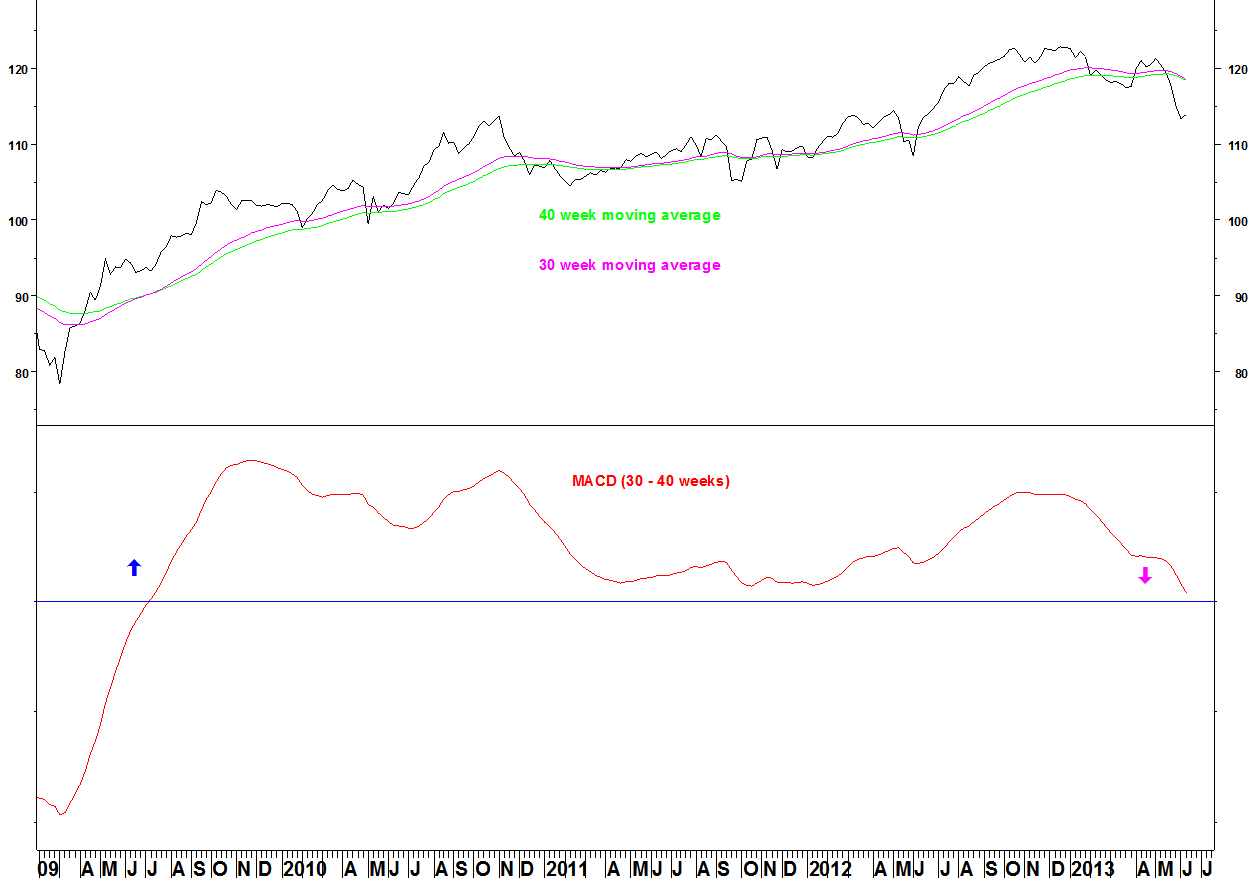
iShares iBoxx $ Invest Grade Corp Bond (LQD)

- The 30 and 40 week moving average last crossed in July 2009
- At the October 2012 high, the MACD was below its 2009 and 2010 peaks, there was a bearish divergence
- A crossover looks likely soon with the price being below the averages
iShares JPMorgan USD Emerging Markets Bond (EMB)
Likewise, the last cross was in July 2009 and following a MACD divergence, a crossover looks imminent
Crossovers would be long term sell signals although there may be a short term recovery after this. These ETFs are the riskier end of the bond market and EMB includes a foreign exchange element. EMB will fall if foreign currencies fall, all else equal.
In February, I showed that if the Dow Jones Coal Index continued to underperform, it would form bullish RSI divergences against the S&P500 Index and the SPDR Energy (XLE). This is a set up that I look for as a medium or even long term buying opportunity, see my methods page.
Four months later, those bullish divergences have now formed.
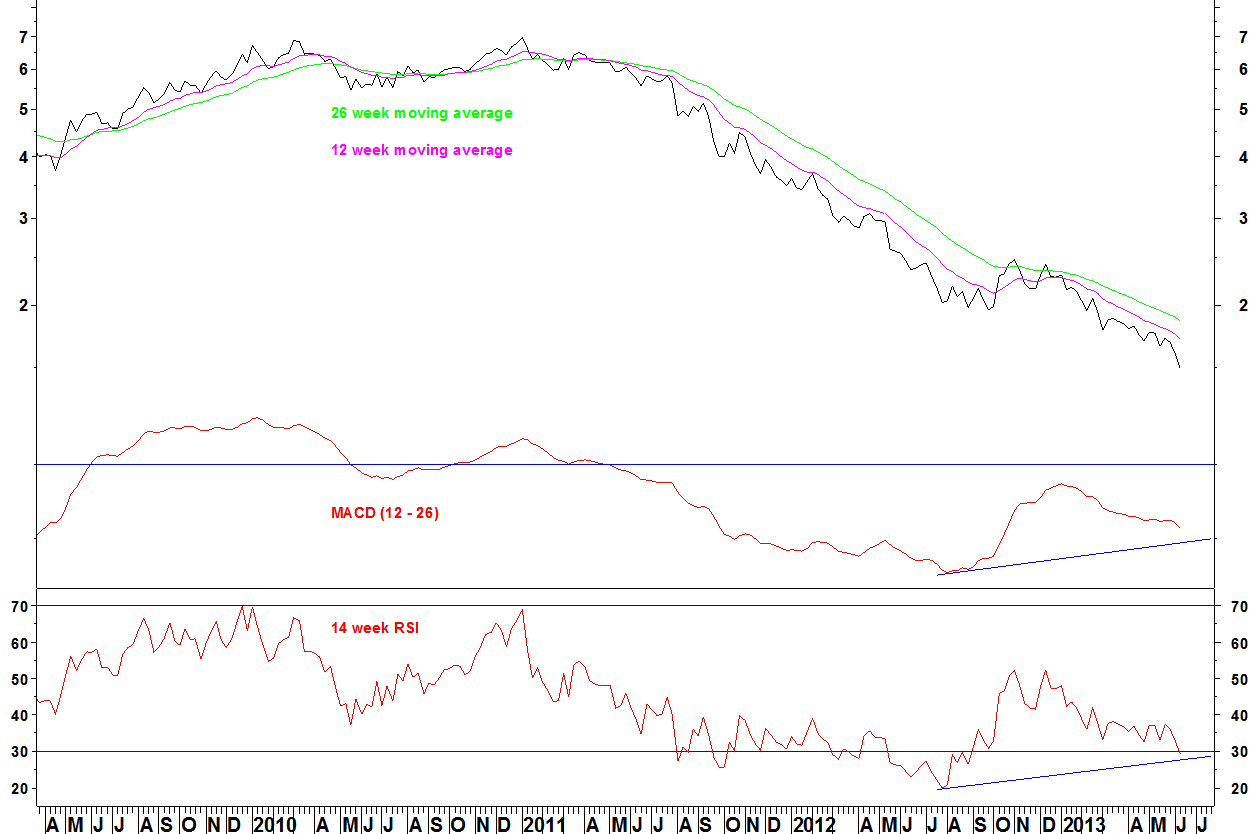
Dow Jones Coal Index v S&P500 Index

The 14 week RSI has a bullish divergence, as does the MACD. The MACD is adjusted to account for the numbers getting smaller as the chart declines. I.E. the divergence forms not just because the numbers are getting smaller.
Dow Jones Coal Index v SPDR Energy (XLE)
There is a similar set up against an energy sector benchmark.
There are no divergences on the daily ratio charts yet as the June decline has been steeper than the spring decline. That is the next feature to look for. We may not get every feature of my ideal RSI divergence criteria perfectly.
For those allocating funds in the energy sector, these are charts to watch over the summer for increasing your weighting in coal stocks.
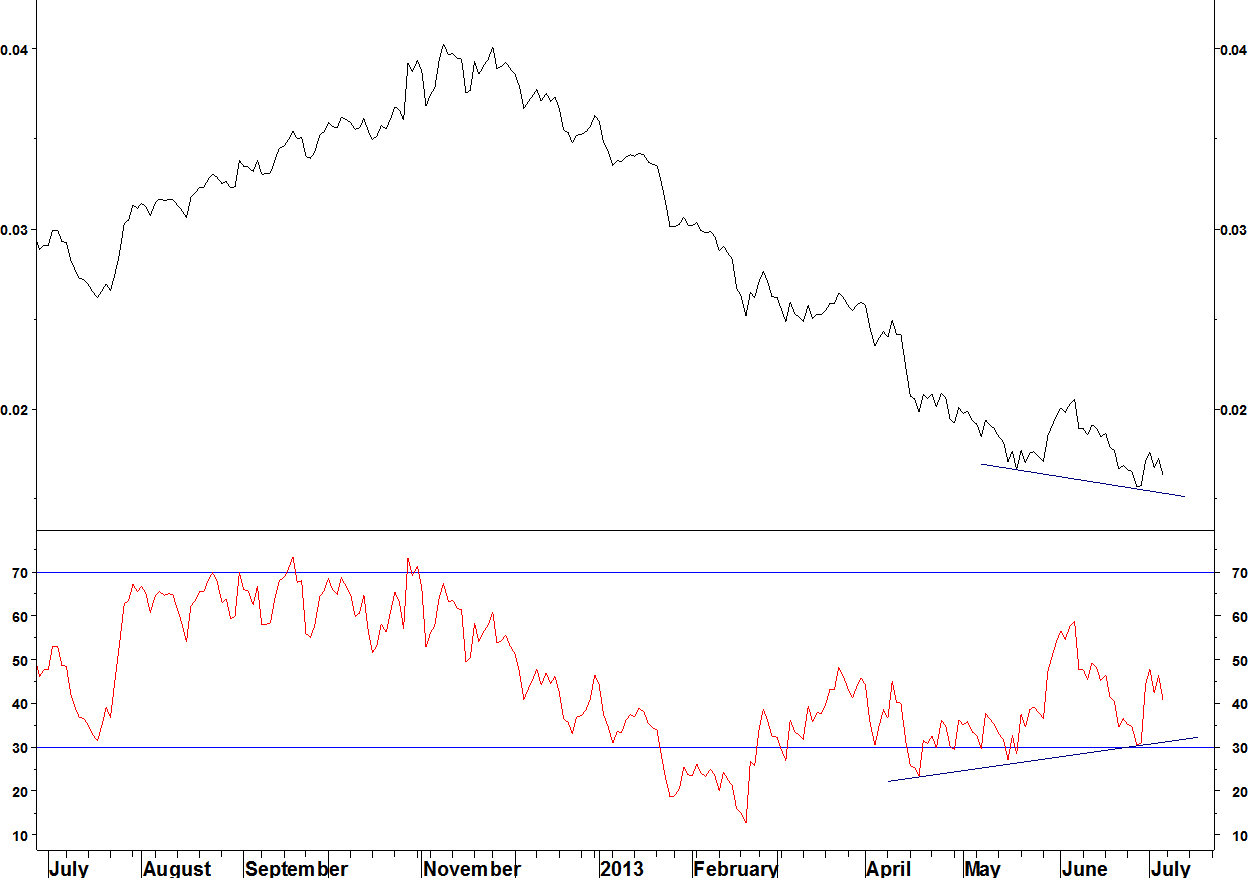
On 06 May, I introduced my new Performance Ranking (PR) method. I showed that when divergence forms between a relative strength line and the PR, supported by a RSI divergence, that this is a good candidate for a reversal.
I showed the example of the DJ Food Index vs S&P500 Index, which has produced many reversals in this way. There was an RSI divergence in early May, backed up by a PR divergence, putting the outperformance of the sector in question.
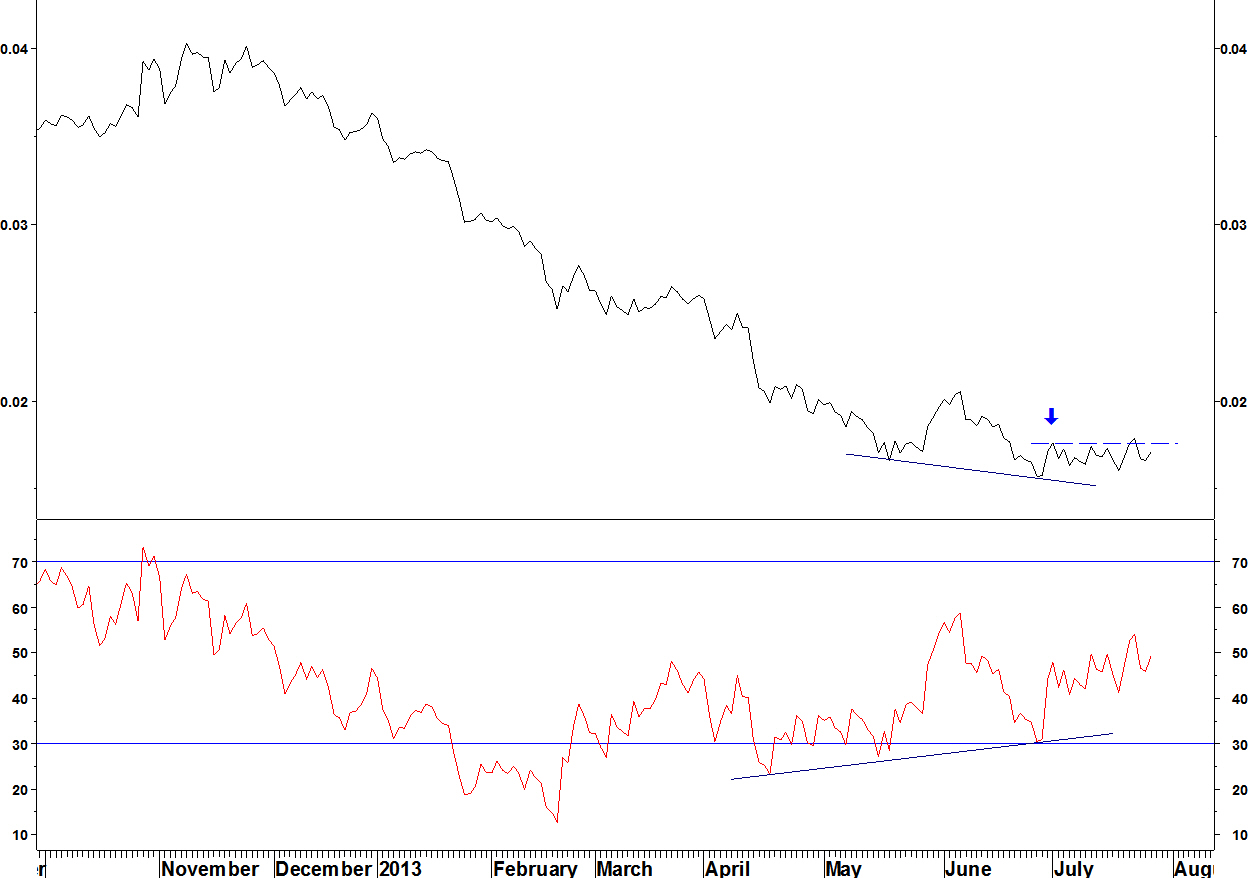
Here is the up to date chart
DJ Food Index vs S&P500 Index and PR
![]()
The RSI and PR divergences have led to a reversal. On the daily chart, there was an RSI divergence on the 19 April high. The PR can also be seen.
![]()
There were two factors making this a less than ideal case at the time.
- The market indices were not even potentially forming a low, which tends to be the case when this sector relative peaks, being a defensive sector
- The PR divergence had not formed over a months, like previous examples
These proved not to matter, for the last month at least and so whilst not an ideal trade entry, anyone allocating funds across sectors should pay attention to PR and RSI divergences and make sure that they are at least not overweight a sector in this situation.
Oil Service pair starts to rally from Performance Ranking divergence
The pair of National Oilwell Varco (NOV) vs iShares Dow Jones US Oil Equipment Index (IEZ) was entered at 1.18973 on 24 May.
The position shows a 2.5% gain so far. I will move the stop loss to break even already.
National Oilwell Varco (NOV) vs IEZ (weekly chart)
National Oilwell Varco (NOV) vs IEZ (daily chart)

The entry criteria defined on 13 May for the National Oilwell Varco (NOV) sector relative strength trade have been fulfilled.
On Friday 24 May, the ratio of NOV versus iShares Dow Jones US Oil Equipment Index (IEZ) broke above the entry level of 1.16691, closing at 1.18973. The pair is bought with a stop loss below the low of 16 May of 1.13413, which is 4.9% lower.
National Oilwell Varco (NOV) vs IEZ (weekly chart)
The move down to the 16 May low did not move the 14 day RSI back below 30, which fits with my RSI divergence entry criteria.
National Oilwell Varco (NOV) vs IEZ (daily chart)

