Gold and Silver Index gives RSI divergence buy signal
On 01 July, I showed the set up for an RSI divergence buy signal on the Philadelphia Gold & Silver Index (XAU). The buy signal, a weekly RSI close above 31.64 from late May was given on the week ending 19 July.
A long position was opened at 94.82, with a stop loss at a new closing low (below 82.29 from 26 June). The position gained 6.4% in its first week.
Philadelphia Gold & Silver Index (XAU)
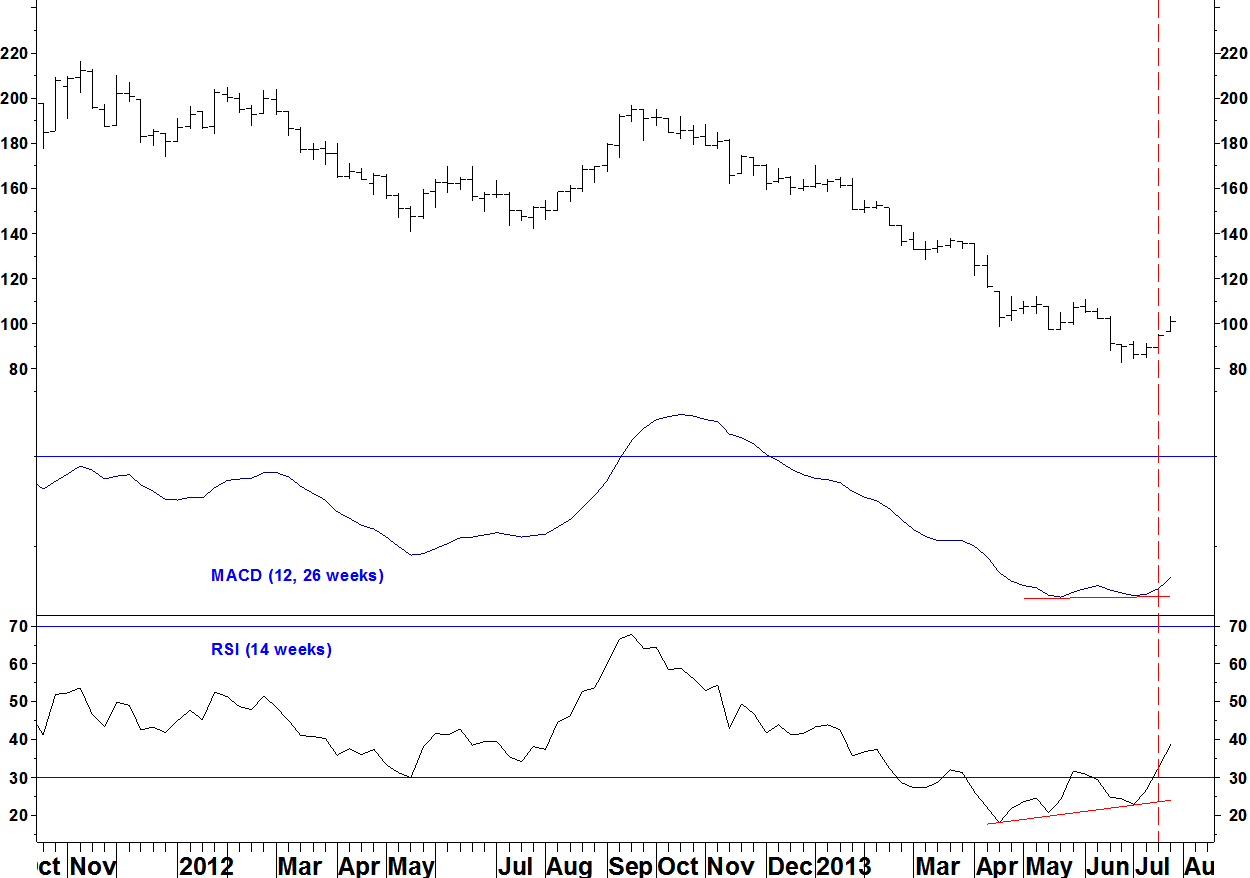
Although the daily RSI did not set up exactly as stated in my ideal criteria, there was a divergence. The MACD has gone positive for the first time since 01 November 2012.
Daily chart

Pairs positions versus S&P 500 Index
On 08 July, a pair of Agnico Eagle Mines (AEM) v S&P 500 Index was shown. This has still not given its entry signal of the weekly RSI breaking its late May high.
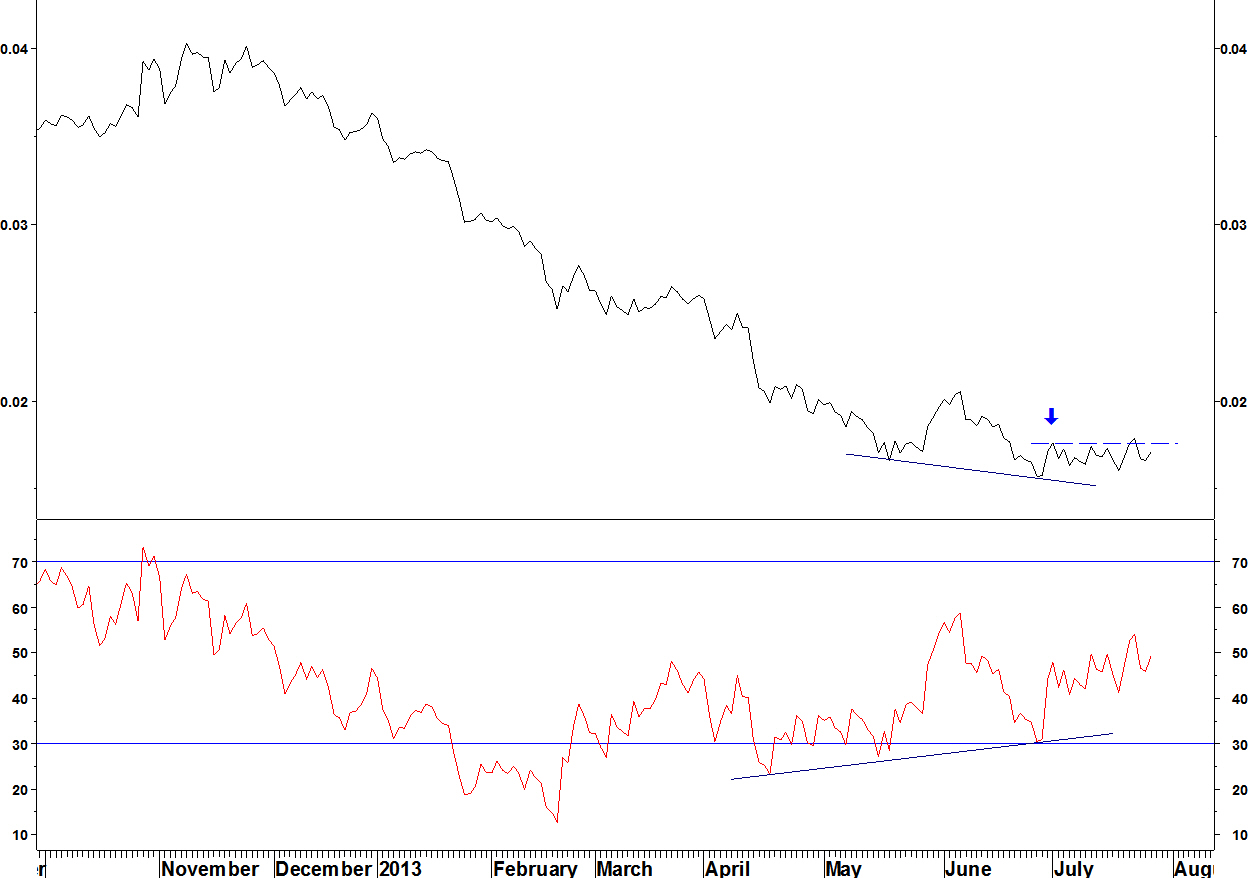
Goldcorp (US:GOLD) vs S&P 500 Index also met the entry criteria. It gave a weekly RSI entry signal on Friday 26 July. The stop loss to a new low is larger than for AEM though (19.5% vs 13.6%) and AEM has a tidier daily chart, in that a weekly entry signal will likely be a move to a new relative high since 01 July (blue arrow). Therefore I will stick to that as a pair, should it be triggered.
AEM v S&P 500 Index