Past and present performance ranking divergence examples from the oil service sector
Here are some examples of divergences setting up according to my new performance ranking method. I’ve ranked performance of the components of the iShares Dow Jones US Oil Equipment Index (IEZ). I show the stock relative to IEZ, along with the RSI of that relative line.
Past example: Baker Hughes (BHI) vs IEZ

- In July 2010 and June 2011, the new relative high is formed with divergences on the 9 week RSI and the Performance Rank (PR)
- Not every low offers a divergence set up, for example, April 2012
- I prefer a 14 week RSI as extreme reading will be rarer but the 9 week RSI worked here
Present example: National Oilwell Varco (NOV) vs IEZ
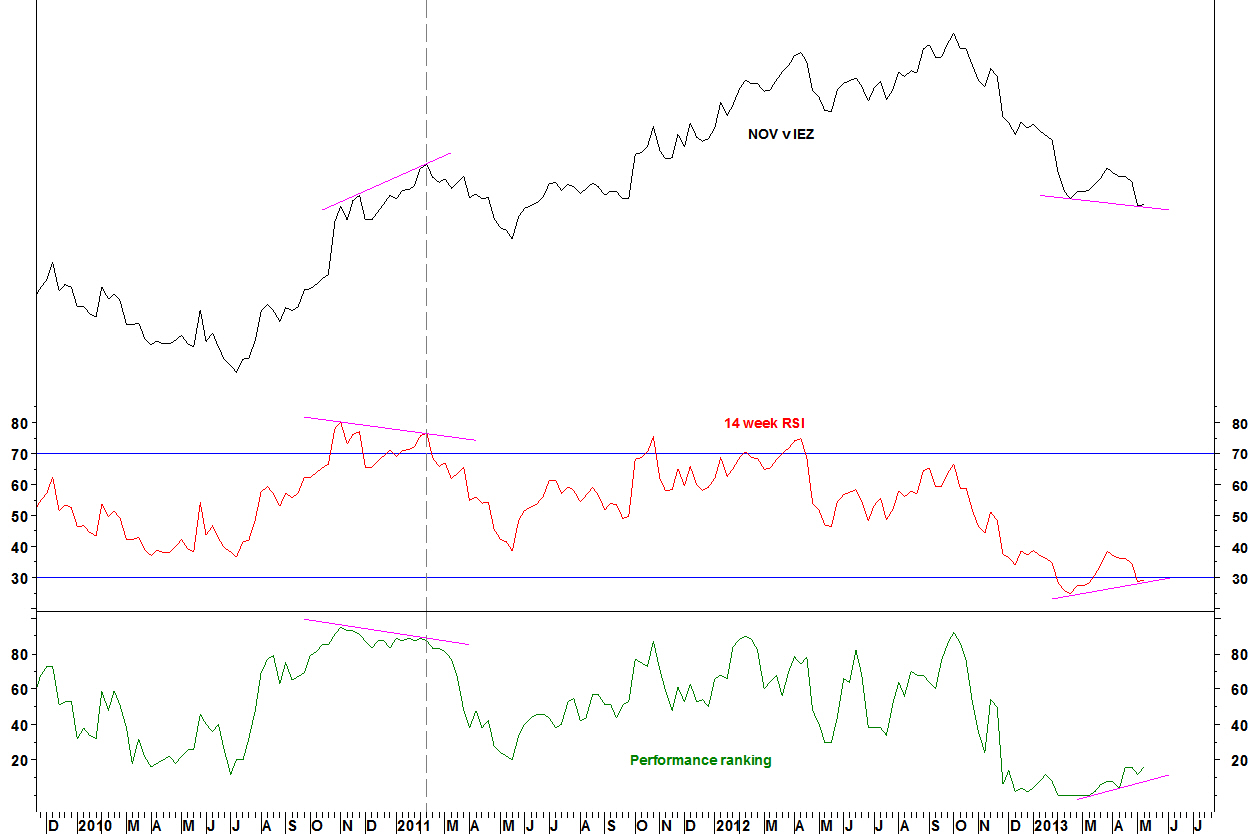
- In February 2011, the relative high is formed with divergences on the 14 week RSI and the PR
- Now, the new relative low is formed with divergences against the February 2013 low
- The 14 week and 14 day RSI set up according to my RSI divergence criteria
Daily chart
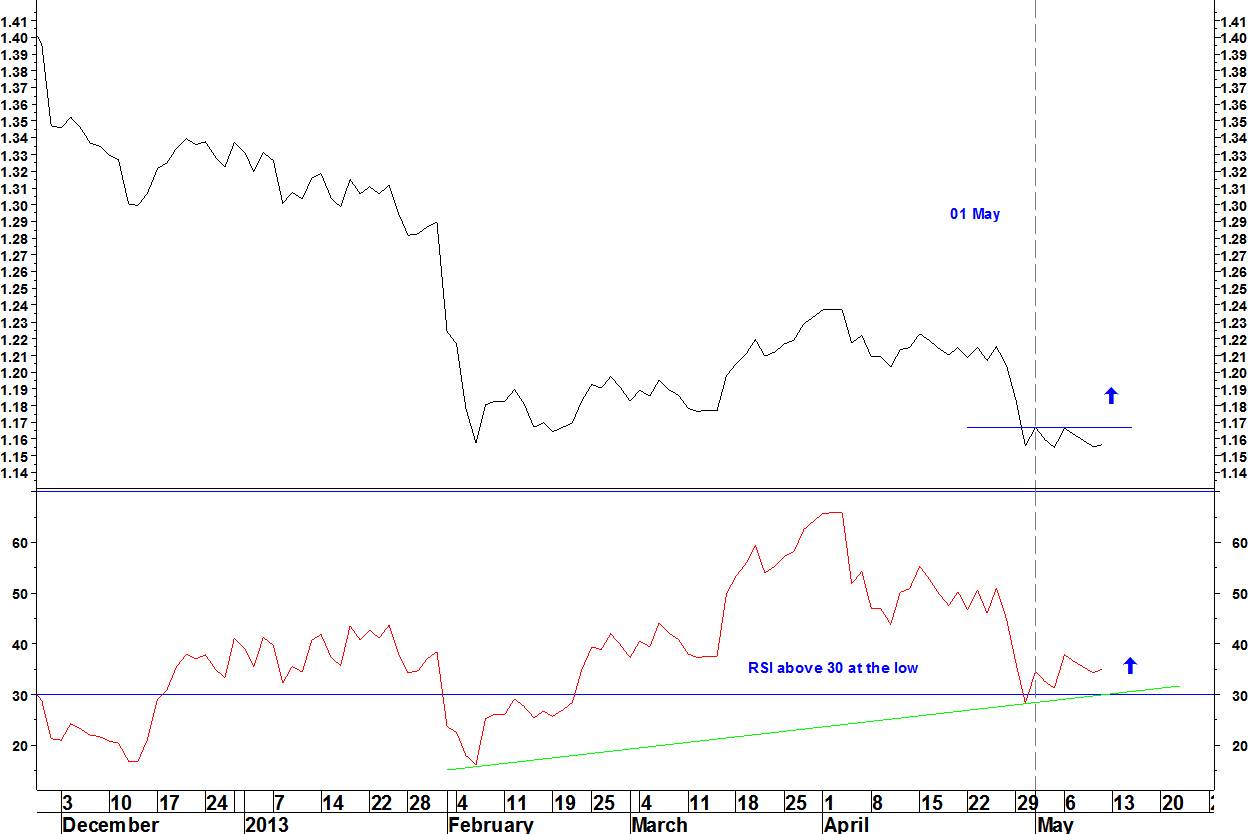
- If the 14 day RSI stays above 30, the buy signal is a move above the small base: above the 01 May high of 1.16691. The stop loss would be a new low
- Check for earnings releases – none upcoming for NOV!
- The position will be opened on an end of day close above 1.16691 with a stop loss as a new closing low. If the relative line moves significantly lower, then it is likely that the daily RSI would go below 30, breaking the daily RSI divergence entry criteria
Leave a Comment
