Coal: Is this untouchable sector on its last move down?
11 February
The Dow Jones Coal Index made a peak against the S&P500 Index in March 2011. Since then the relative strength line has fallen by 73.2%. Dow Jones Coal Index v S&P500 Index
In recent months, it showed some suggestions of basing but it was not an ideal set up. Now, a much more ideal set up is a possibility, one that could meet my RSI divergence criteria.
If the relative chart can continue down, make a new low and form bullish RSI and MACD divergences, that would be a good point to look to buy coal stocks on a relative basis. Looking at other sectors against the coal sector, there is good commonality of this set up. Even against the broader energy sector, the set up is the same. Dow Jones Coal Index v SPDR Energy (XLE)
One of the coal stocks, Arch Coal (ACI), has already made a new low against the S&P500 Index.
Arch Coal (ACI) v S&P500 Index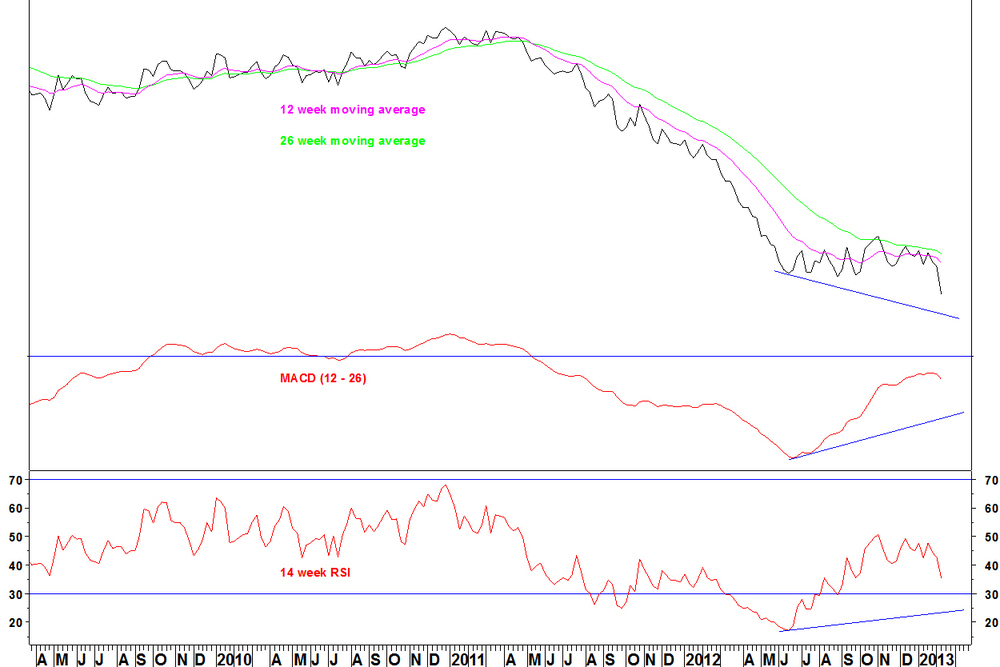
I want to see the RSI go below 30 for a divergence signal, then I can look at the daily chart for an entry signal.
On price, ACI made a new weekly closing low. I’d like to see it move below the summer 2012 low of $5.11 and RSI to go below 30, then look at the daily chart for an entry. Arch Coal (ACI) weekly price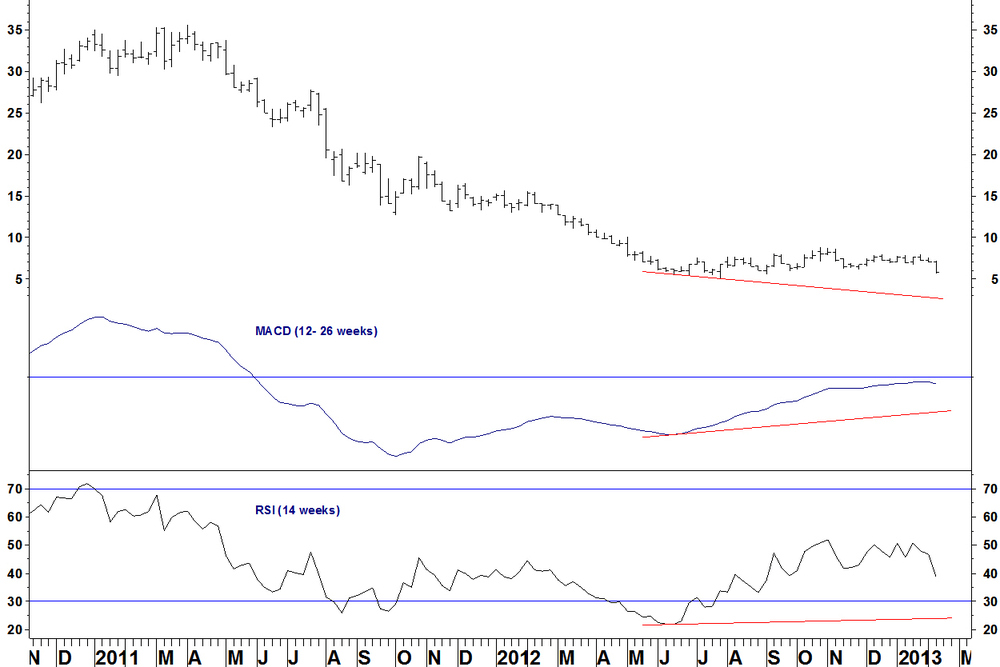
Leave a Comment
