Dow Jones Industrial Average forms bearish weekly RSI divergence
My RSI divergence method looks for weekly divergences on the 14 week RSI. The SPDR Dow Jones Industrial Average (DIA) now has this.
SPDR Dow Jones Industrial Average (DIA)
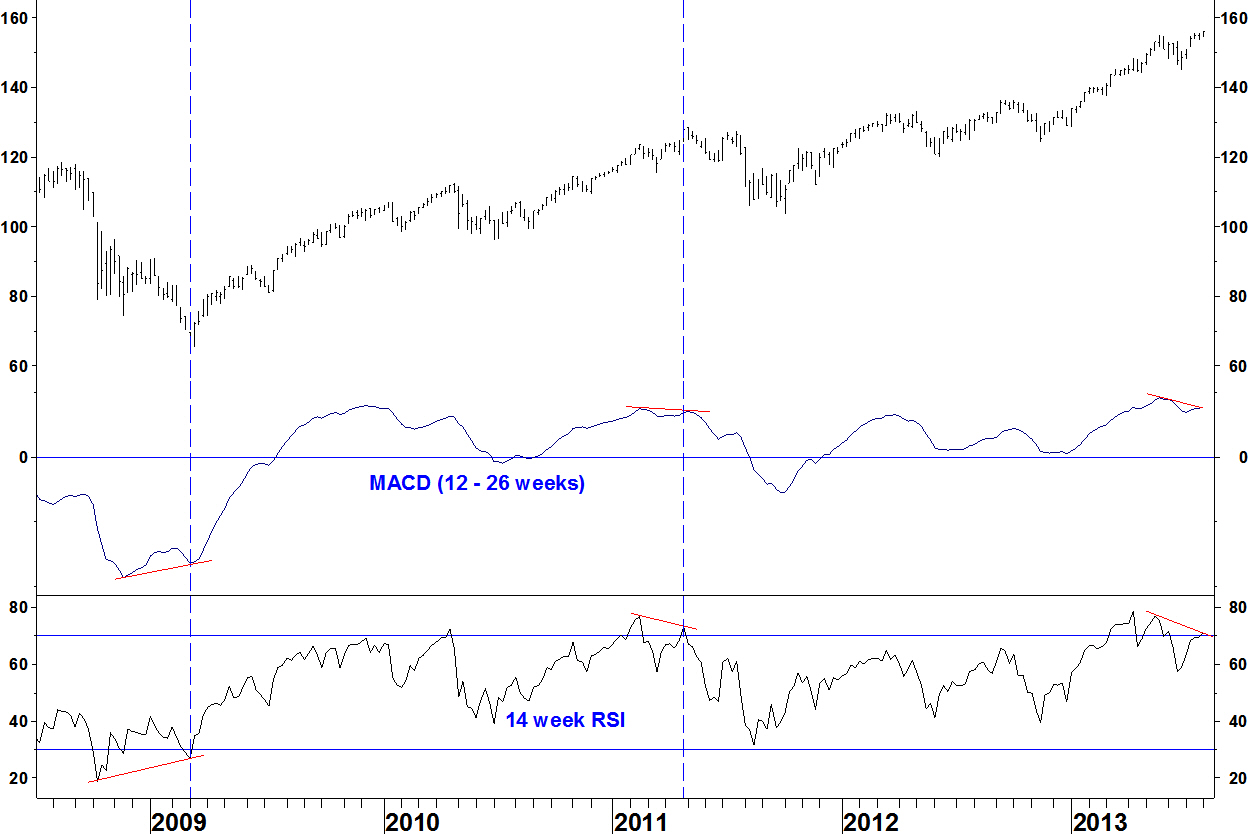
- There are weekly RSI and MACD divergences against the May high
- The May 2011 high was formed with the same divergences.
- The March 2009 low was formed with bullish divergences for these indicators
Expect the index to move lower in the next few months but note that the sell off from the April 2011 high came in two stages and most of it within a two week period in early August. These divergence sometimes mark long term turning points, as in 2009 but not always, as in 2011. The S&P500 Index also has this divergence, whereas the small cap and NASDAQ indices do not.
Daily chart

There is a bearish divergence against the May high but not an exact match to my criteria on the daily charts for RSI divergence trades. I will look for examples that match the criteria exactly.
A move below the intervening weekly RSI low of 65.98 from 14 June would be a sell signal. Alternatively, a weekly reversal bar could be taken, which would be less certain but have a tighter stop loss.
Gold
The position in the Philadelphia Gold & Silver Index (XAU) has moved back into a slight loss, although nothing has changed on the weekly chart, the stop loss of a new low remains in place. The pair involving Agnico Eagle Mines (AEM) has not met its entry criteria.

Thaanks for sharing this