Emerging markets show relative reversionary potential
Six months ago, I showed the potential risk in the market and it did not play out. I mentioned that most tops set up with a divergence but that not every divergence is a top. Well, that certainly proved to be the case with Apple.
More surprising to me was that the moving average crossover on the Russell 2000 Index was negated, although I also pointed out the drawbacks of this method.
Russell 2000: Long term moving average crossover negated
Not deterred, I will use the long term moving average crossover method again to show the potential for a long term change. It is the improvement in the performance of some emerging markets against the S&P 500 Index.
iShares Emerging Markets (EEM) versus S&P 500 Index ETF (SPY)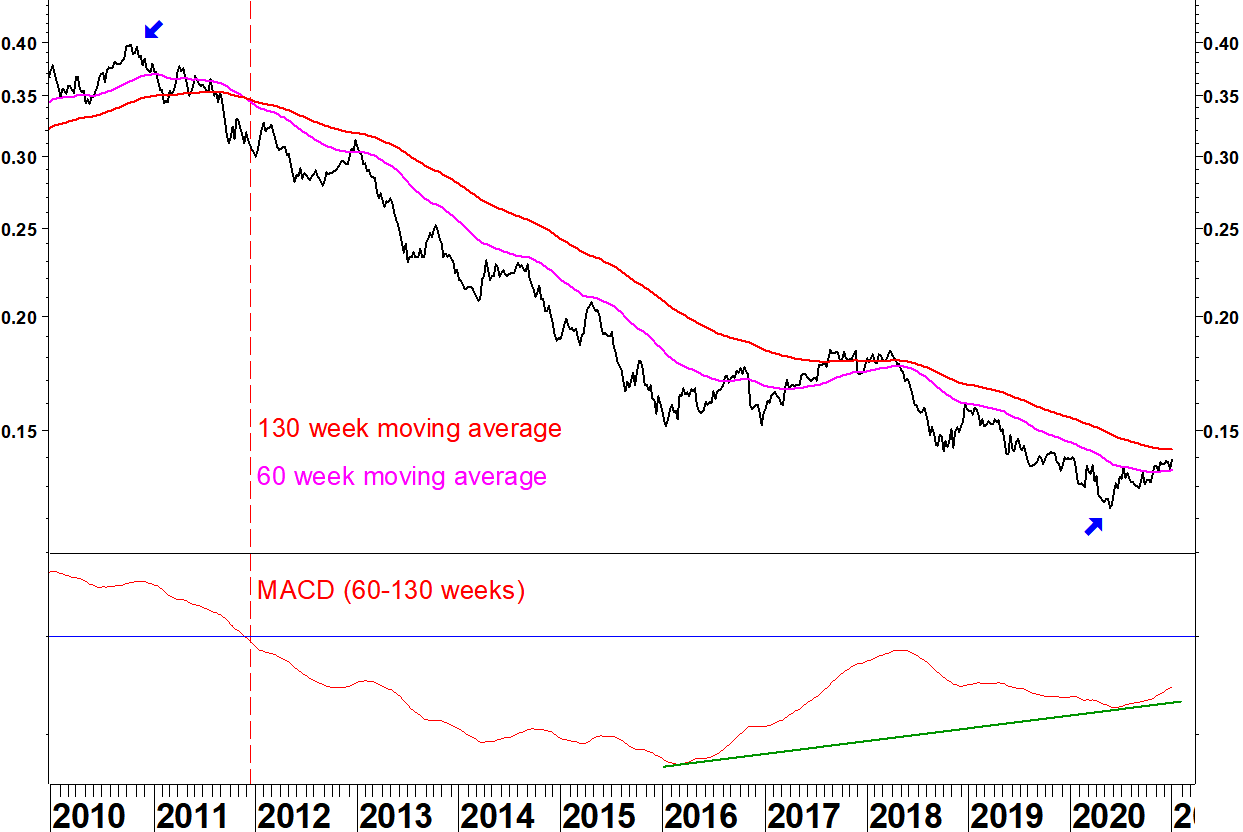
Emerging markets underperformed US markets throughout the previous decade. The ratio dropped by 69% from peak to trough (October 2010 to May 2020). To recover all that would be outperformance by emerging markets of 222%! Even recovering a fraction of that would be significant outperformance.
With this method, you can hand pick moving averages to demonstrate the point. Shorter moving averages show a bullish crossover in 2017, only for it to be negated, so this method needs using in conjunction with other inputs.
The lower chart is a MACD of the two moving averages, adjusted for the scale. It shows a bullish divergence: the averages moved closer together when adjusted for their level. There is the makings of a relative base here but it must do more.
Taiwan leads
iShares Taiwan (EWT) versus S&P 500 Index ETF (SPY)
This ratio did not make a new low in 2020 and the moving averages have made a bullish crossover. It looks like a base. Again, you might have thought that in 2017 but at present, Taiwan is the leader amongst emerging markets.
Chinese small caps possibly form a relative base
iShares MSCI China Small Cap (ECNS) versus S&P 500 Index ETF (SPY)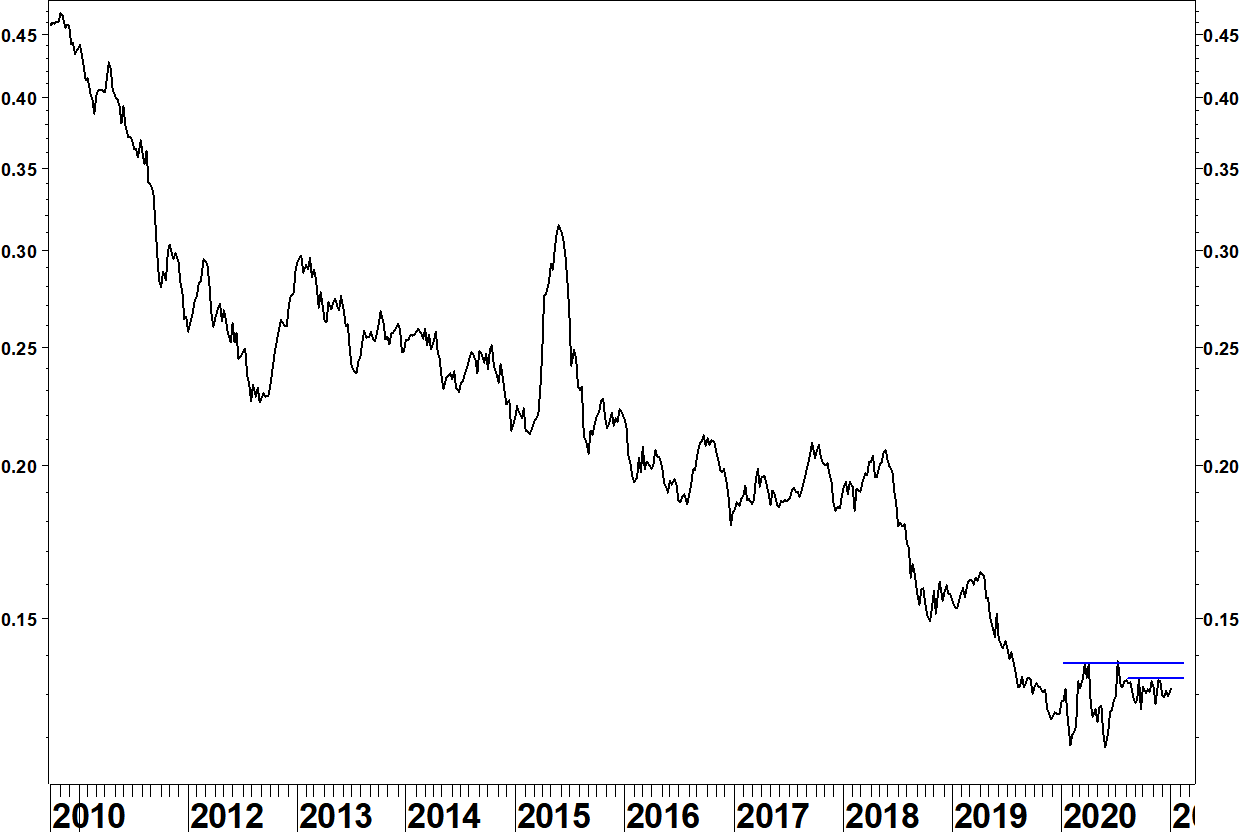
This ratio has dropped hugely over the last decade. There are two resistance levels shown that if broken, could start an outperforming trend.
Dollar effect on ETF ratio charts
These charts show ratios of US listed ETFs, so they don’t need adjusting for forex movements. The US Dollar has weakened recently, which helps the relative strength of non US ETFs.
The Dollar Index does not include emerging market currencies but during 2020, the Dollar has shown commonality in its moves against most currencies, whether developed or emerging market.
US Dollar Index

Since late October, the Dollar Index has made another move lower. There is a bullish divergence on the 9 week RSI. This is a method I have used to identify possiblities for reversion but as with Apple, remember it shows a risk rather than a certainty. I shortened this from the usual 14 periods to get a divergence below 30, so it isn’t as good a set up as in early 2018 but you should be aware of the potential for reversion.
The effect of this Dollar Index fall since late October on the relative strength of the European equities ETF is shown below.
iShares Europe (IEV) versus S&P 500 Index ETF (SPY)
IEV remains in a relative downtrend, there is no sign yet of a relative base. The strengthening Euro during the last two months of 2020 has only moved this ratio back to the falling moving average.
Effect on relative strength of emerging markets
The Dollar is unlikely to give the help to emerging market relative strength in early 2021 that it did during the last two months of 2020. That isn’t the only determinant though. The performance of emerging markets in local currency terms is the other (bigger) factor.
The 69% underperformance of emerging markets over the last decade could give a big push to a reversionary trend.
iShares Emerging Markets (EEM)
The emerging market ETF has gone nowhere since April 2011. For a long time, I saw this sideways movement as a problem: if it can’t make progress when US markets are rallying, surely it will fall when US markets flatten off or decline.
Shanghai Composite Index
This index has gone sideways for five years but didn’t break its late 2018 low in March 2020, unlike many western indices. The March to July gains have been consolidated, so watch for this moving higher and breaking resistance from 2018 and 2015. This market showed between mid 2014 and mid 2015 what it can do in a bullish climate.
Conclusion
There will still be commonality with western markets but the long term relative reversionary potential will start having a positive effect on emerging markets. Taiwan has been an early leader but keep an eye on other markets and individual stocks for moves to outperformance.
Bear in mind that emerging markets can still capture the imagination of western investors to feed a trend of outperformance. Many of the themes that could get discussed (growing middle class, increased energy use, improved corporate governance) have been happening since 2011, they just haven’t been rewarded yet.
