Coal sector relative strength reaches bullish divergence
In February, I showed that if the Dow Jones Coal Index continued to underperform, it would form bullish RSI divergences against the S&P500 Index and the SPDR Energy (XLE). This is a set up that I look for as a medium or even long term buying opportunity, see my methods page.
Four months later, those bullish divergences have now formed.
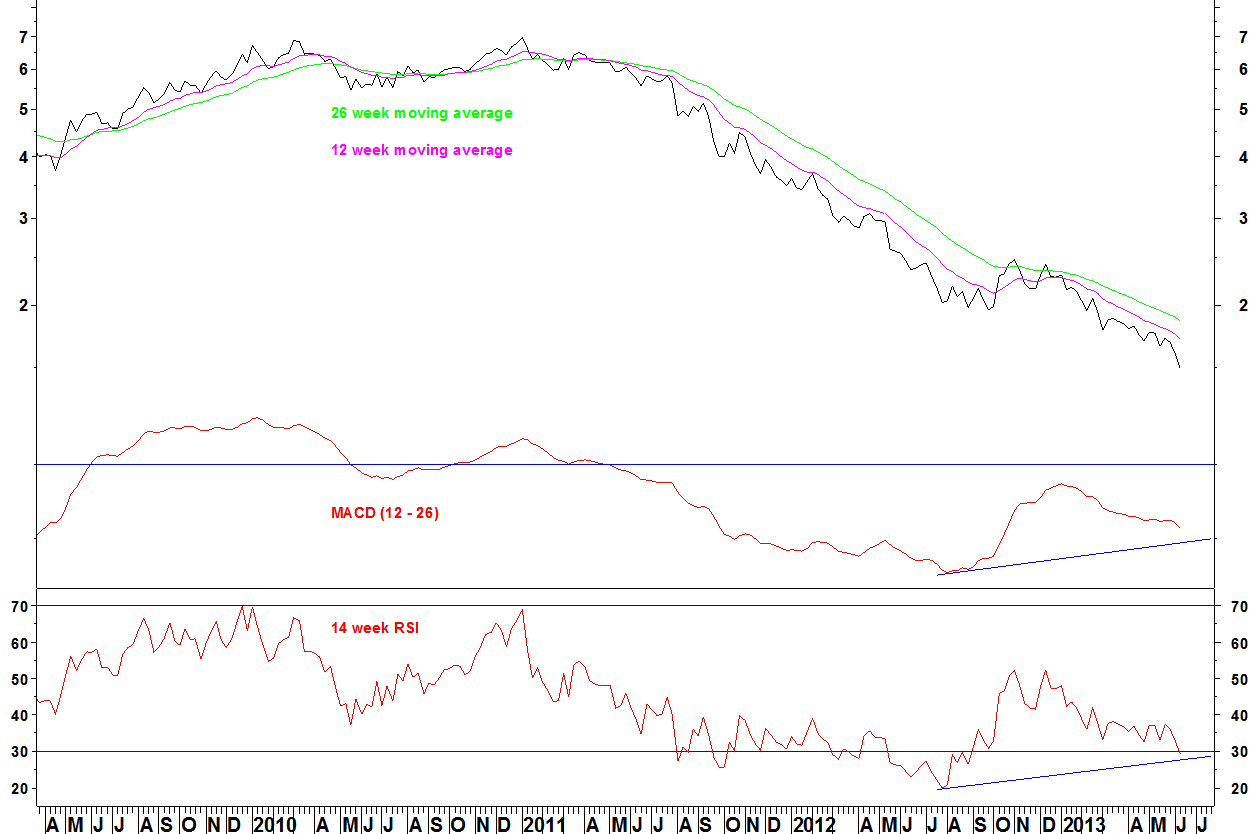
Dow Jones Coal Index v S&P500 Index

The 14 week RSI has a bullish divergence, as does the MACD. The MACD is adjusted to account for the numbers getting smaller as the chart declines. I.E. the divergence forms not just because the numbers are getting smaller.
Dow Jones Coal Index v SPDR Energy (XLE)
There is a similar set up against an energy sector benchmark.
There are no divergences on the daily ratio charts yet as the June decline has been steeper than the spring decline. That is the next feature to look for. We may not get every feature of my ideal RSI divergence criteria perfectly.
For those allocating funds in the energy sector, these are charts to watch over the summer for increasing your weighting in coal stocks.
