Gold stock pairs trade with Agnico-Eagle Mines (AEM)
This week I’ll show a gold stock: Agnico-Eagle Mines (AEM) with a bullish 14 week RSI divergence against the S&P500 Index.
Gold stocks have dramatically underperformed the S&P500 Index since September 2011.
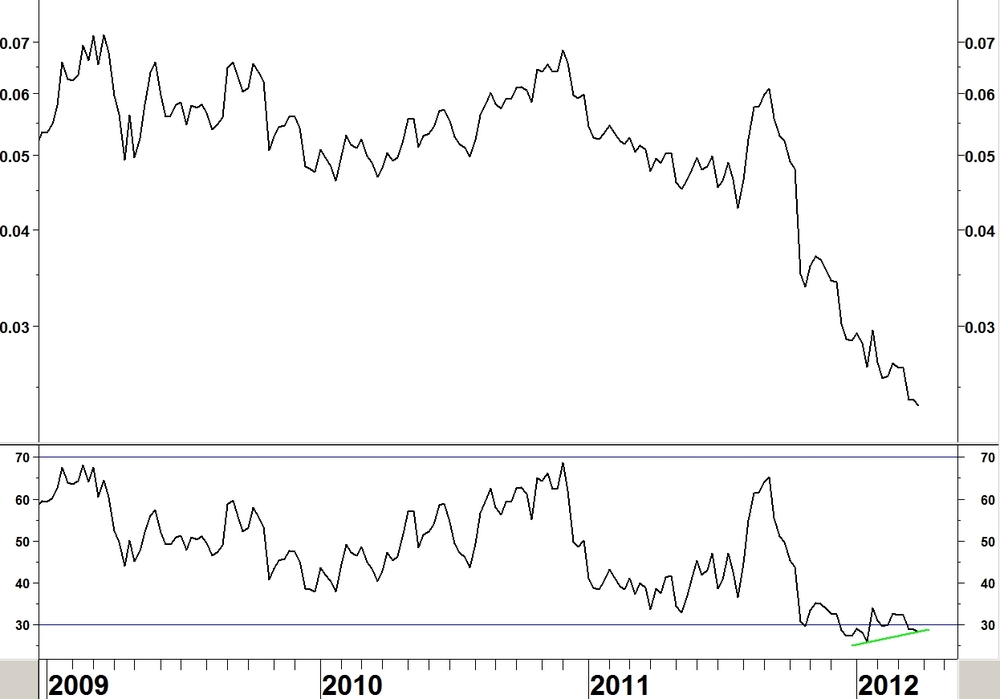
Now compare AEM against other gold stocks Agnico-Eagle Mines (AEM) versus Philadelphia Gold & Silver Index (XAU)
- In this case the divergence was in place through the winter. The rally from the February low has taken the RSI back above 30
- The shallower decline of the last leg down is evident
The daily ratio chart shows the other criteria being met.

- Successive bullish daily RSI divergences that fail to stem the decline
- A divergence that has the RSI above 30 at the low
- There isn’t a weekly MACD divergence (preferable but not essential) but there is a daily MACD divergence
- Now the initial rally has taken place, the ratio consolidated since 09 March
- Monday’s action (not yet shown) had AEM up 4.73% and XAU up 1.97%, breaking the 09 March high (blue line)
- That is a buy signal for this pair, with the stop loss below the red arrow, the 21 March minor low (5% lower)
Last Monday’s idea hasn’t worked so far [buy iShares Broker Dealers (IAI) versus iShares Emerging Markets (EEM)]. It hasn’t been proved wrong yet and is nowhere near its stop but you can often tell which ideas will work by how the trade starts off.
Leave a Comment
