Gold and Silver Index reaches bullish divergence
The Philadelphia Gold & Silver Index (XAU) has formed a bullish divergence on its 14 week RSI. There is also a slight MACD divergence.
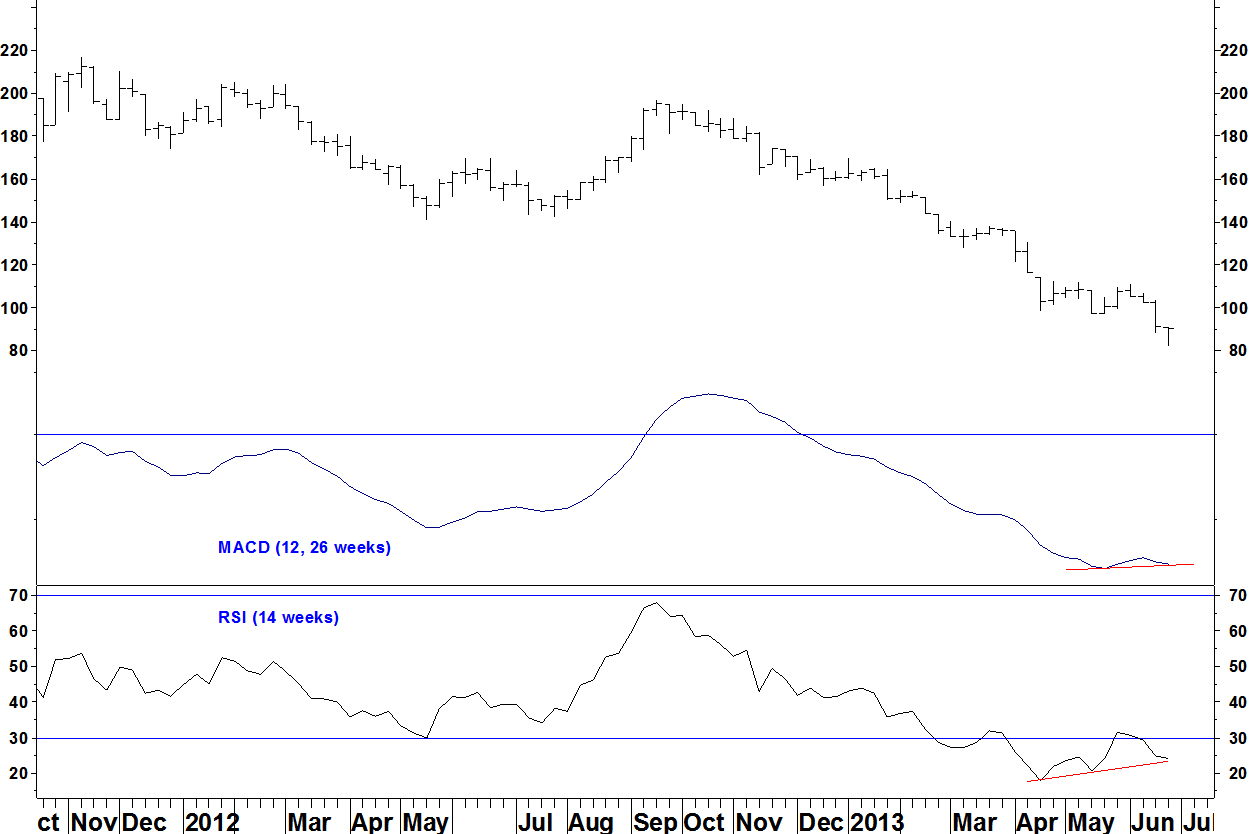
The daily chart also has RSI and MACD divergences, although there isn’t an RSI above 30 as per the ideal entry criteria.

The last bullish weekly RSI divergence on this index that was formed within a single chart trough (as opposed to across troughs further apart), was in January 1998, so these are rare. The index rallied over 50% from that low but still went sideways for months after the initial low. The point is, these weekly RSI divergences don’t always bear fruit immediately.
I will open a long position on a weekly close of the RSI above the intervening peak of 31.64 from the week ending 31 May. The stop loss will be a close below the low of 82.29 from 26 June. You could use the Market Vectors Gold Miners (GDX) for this trade.
