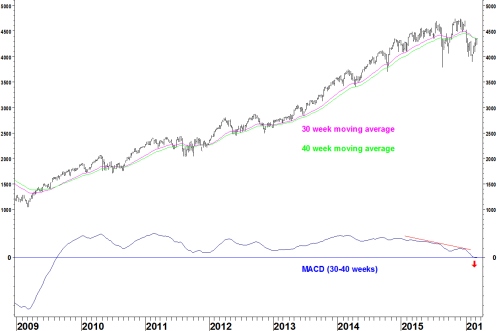
NASDAQ 100 Index has long term moving average crossover
There has been a decent rally from the bullish breadth divergence that I identified in mid February. Now, major indices have rallied back into long term moving averages that have turned downwards.
A specific set up I look for is a long term moving average crossover, as explained in the My methods section.
NASDAQ 100 Index
- The 30 and 40 week moving averages last crossed over in August 2009
- Divergence on the MACD indicator has been building since early 2014 and this was more pronounced when the final high was made in early December 2015
- The moving averages first crossed in the last week of February, remember that the cross is not an exact timing tool
- Now that price has rallied into falling moving averages, that makes price more vulnerable to continuing the topping process
Trading tactics
Enter a short position in the NASDAQ 100 Index on the next weekly reversal, with a stop loss above the most recent high. A weekly reversal this coming week will be below 4,232.08 or on the NASDAQ 100 Trust ETF (QQQ), below Thursday’s low of $103.31.
I will record this trade in the P&L for this site when it eventually is triggered.
Leave a Comment
