Performance Ranking method example: PPG Industries has bearish divergence
My Performance Ranking divergence method looks for sector relative charts with divergences on the 14 week RSI and the sector Performance Rank (PR).
An example I’ve been monitoring for a while is PPG Industries (PPG) versus the SPDR Materials (XLB).
The PR shows how PPG ranks on price performance against every other component of XLB over a weighted average of time periods.
PPG Industries (PPG) versus SPDR Materials (XLB)
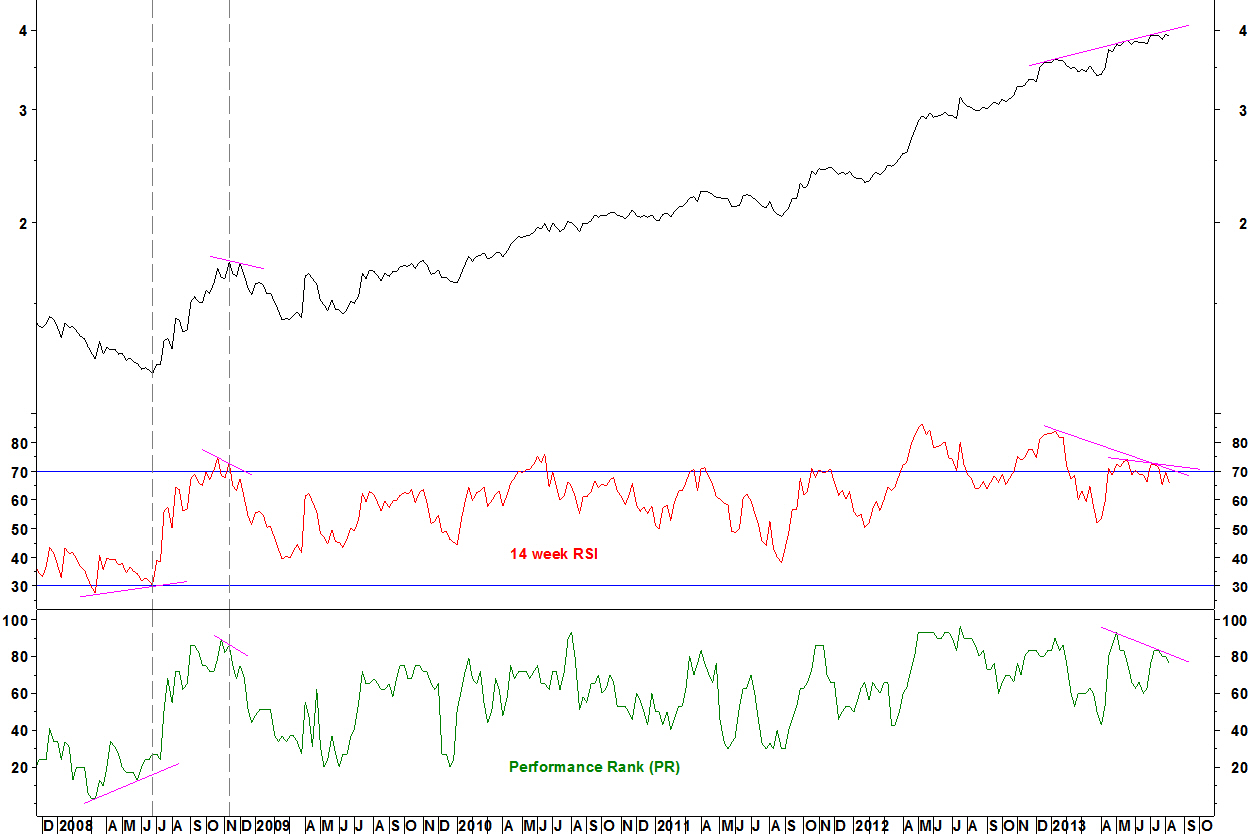
- In June 2008, the low for PPG versus XLB is formed with a bullish divergence on the PR. The RSI is also higher than in March 2008, slightly above 30
- In November 2008, the high in formed with short term bearish divergences on the PR and RSI
- Now, the relative high forms with a bearish divergence on the PR against May 2013
- Also, the RSI has bearish divergence against January and May 2013
Daily chart
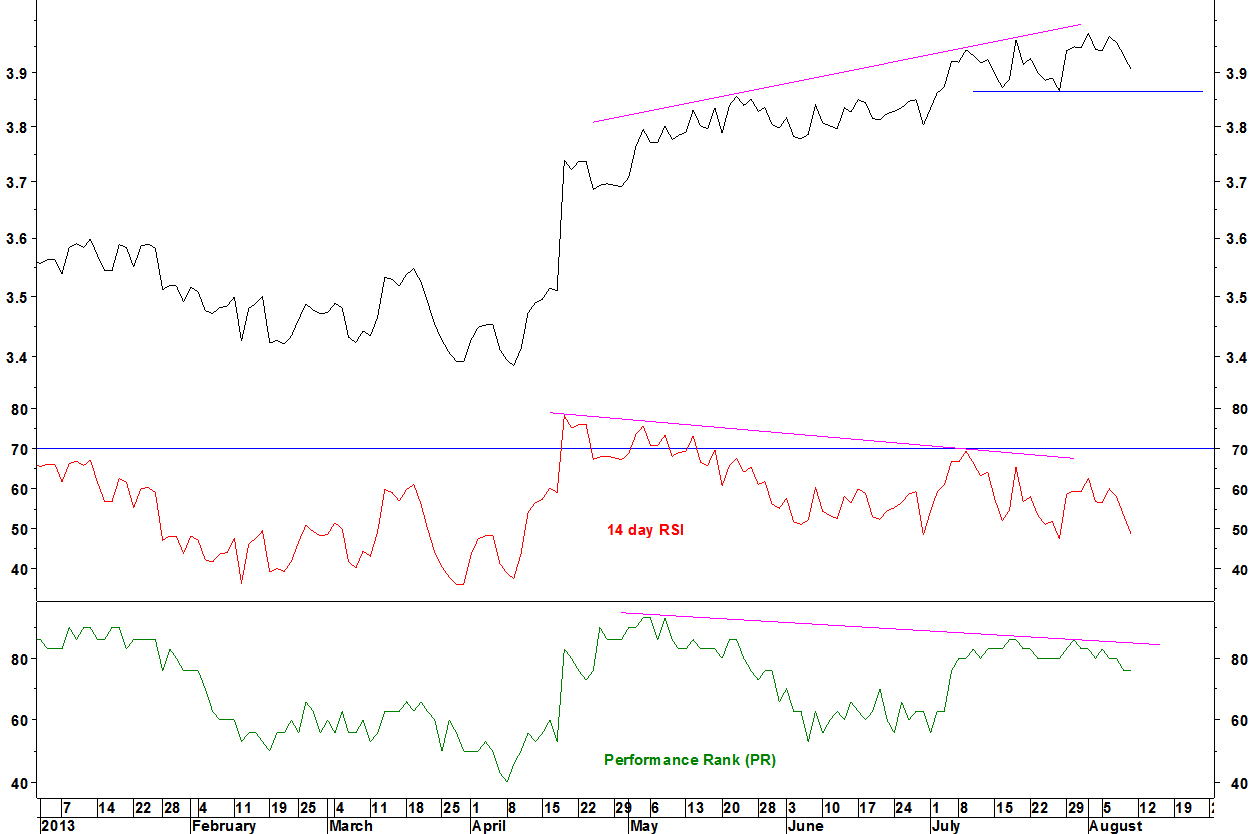
- The RSI formed divergence since April, first above 70 and now below 70, matching my RSI divergence criteria
- The PR divergence is shown. Also it has made a low since early July
The weekly RSI has already broken below the intervening low since the May high (the low since the January high is much lower). A move below the low of 26 July of 3.86565 will be a new low since early July.
That will be taken as the signal to open a short position in this pair. The stop loss will be a new high, which is above 3.97597 from 01 August, 2.9% higher.
