The position in International Flavors & Fragrances Inc (IFF) vs SPDR Materials (XLB), shown last week, has now been entered. The pair broke below the 20 June low on 05 September.
The position is opened at the closing value of 05 September of 1.94066. The stop loss is above the 06 August high, which is 5.8% above the entry level.
The daily RSI is now oversold so there may be a short term recovery but it is the longer term divergences that have prompted this position.
The position in Agnico Eagle Mines v S&P 500 Index continues to pull back. It has done nothing wrong in terms of its long term development, having formed a bullish RSI divergence at the August low.
The percentage moves in this chart are quite large. Should it go wrong, I don’t want this to affect my P&L too much. This pair would still have to fall another 17.3% to make a new low and stop the position out and that is a bit much.
Therefore I am halving the position size in this pair from this morning.
We can always examine pairs from the Price Ranking (PR) candidates to see whether they match the RSI divergence entry criteria. Here is one that does.
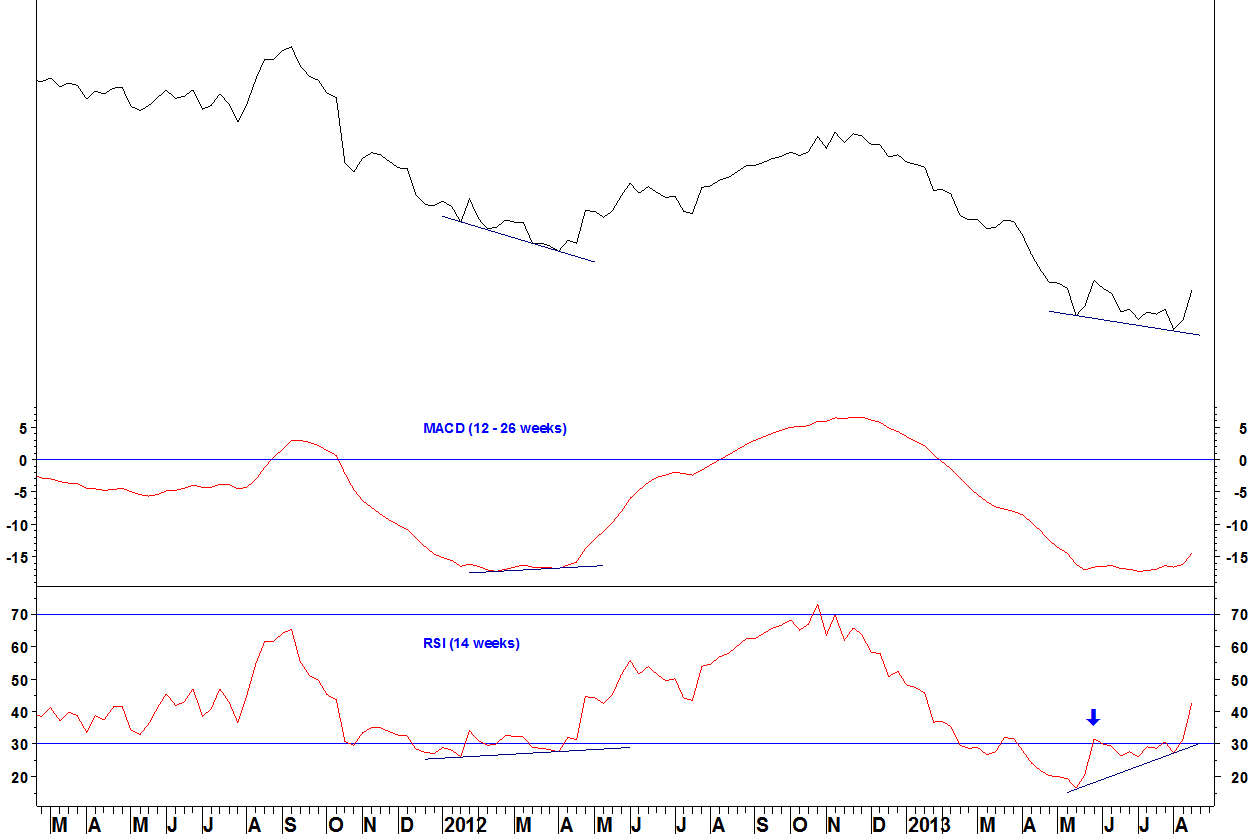
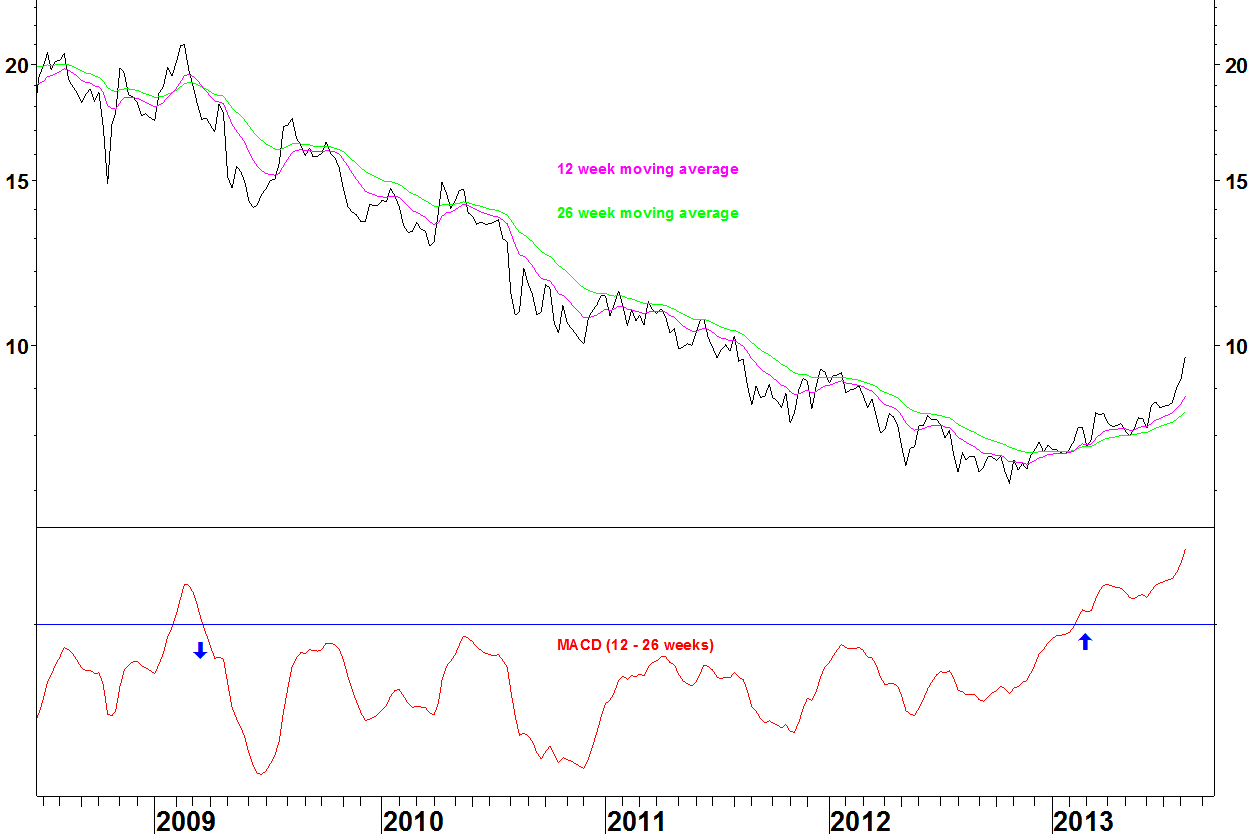
XOM v TWX weekly chart
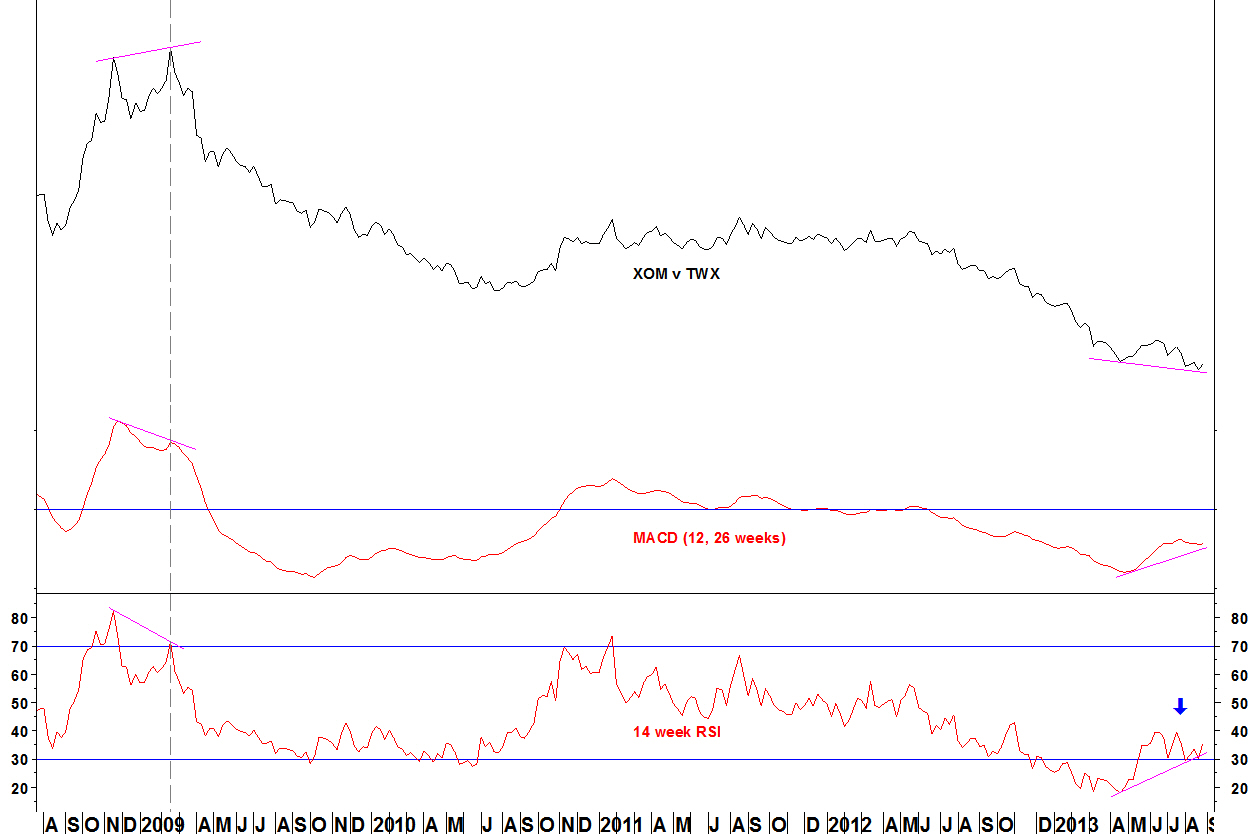
- The previous divergence set up marked the February 2009 peak
- There is bullish divergence on the MACD and the 14 week RSI
- An RSI buy signal is a move above the intervening RSI high of 39.6 from 19 July (blue arrow)
- The RSI divergence entry criteria state preference for a weekly RSI close above the intervening high, which could delay the entry but makes it a safer trade
XOM v TWX daily chart
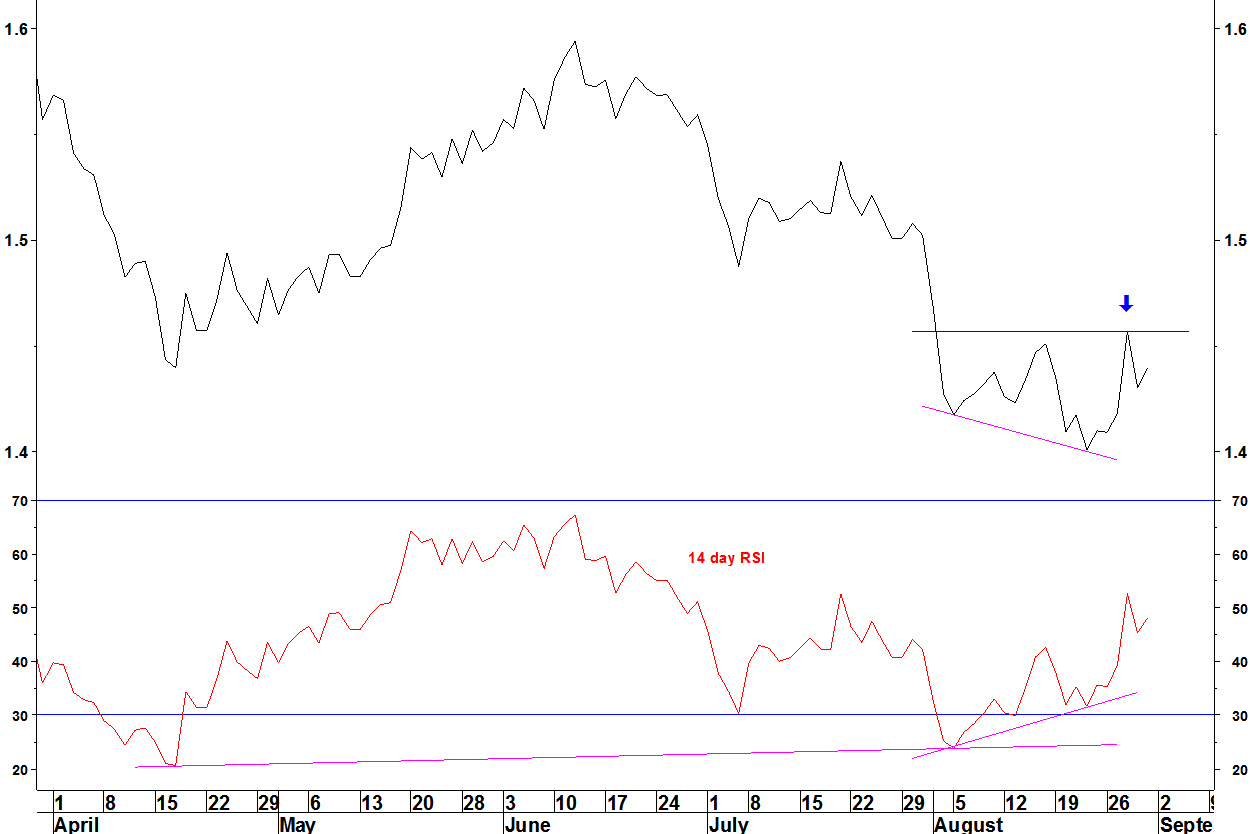
- There is divergence against the April trough and within this trough
- The low of 22 August came with RSI above 30, meeting the daily RSI entry criteria
- A move above the 28 August high (blue arrow) will be a high since 01 August
A long position will be opened in this pair on two conditions:
- A close for the 14 week RSI above the intervening high
- A move above the 28 August high
The stop loss will be below the 22 August low, 3.8% below the 28 August high.
The following S&P 100 Index components have or are close to meeting the criteria for Performance Ranking (PR) trades. Stocks are shown relative to the S&P 100 Index, with the 14 week RSI of this relative line and the PR of the stock within the 100 index components.
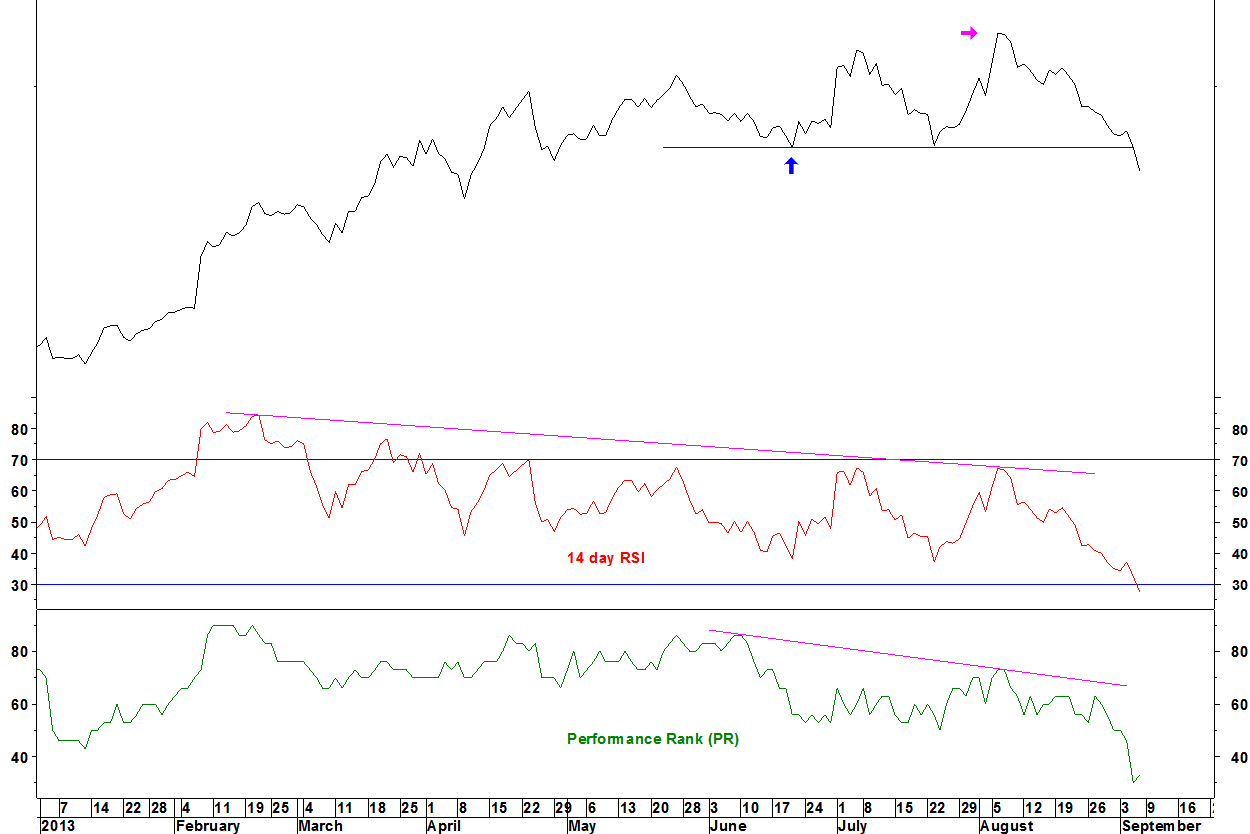
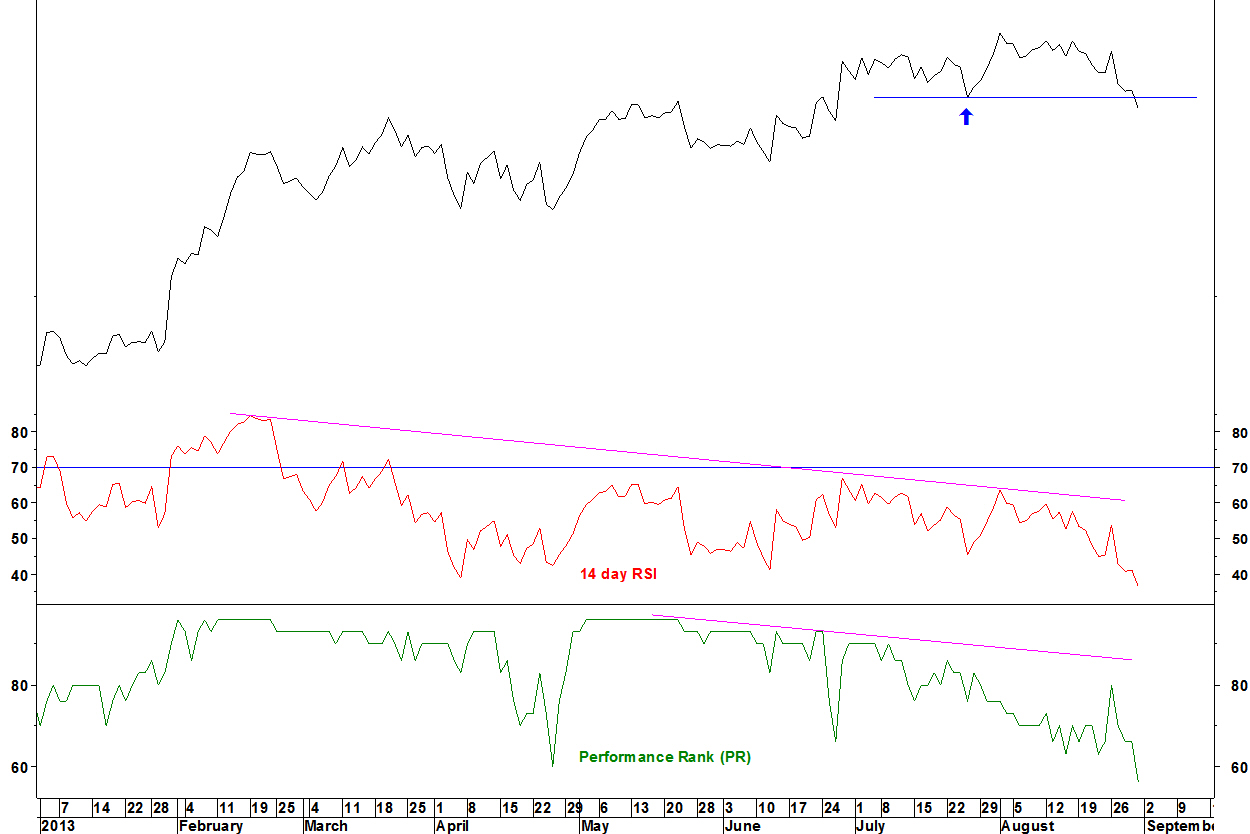
Honeywell (HON)

- The pair makes a new high with bearish divergences on the 14 week RSI and the PR
- The September 2011 relative low came with bullish RSI and PR divergences (dashed line)
- A sell signal is a weekly close of the RSI below the intervening low (blue arrow)
Daily chart

- A new high was made on 20 August (purple arrow), with RSI below 70, having already been on a divergence. This matches the daily RSI divergence criteria
- A move below the 16 July low (blue arrow) will be a two month relative low
A short position in HON v OEX will be opened if two conditions are met:
- A close for the 14 week RSI below the intervening low
- At the same time, a close below the low of 16 July
The stop loss will be a new high, 1.8% above the 20 August high.
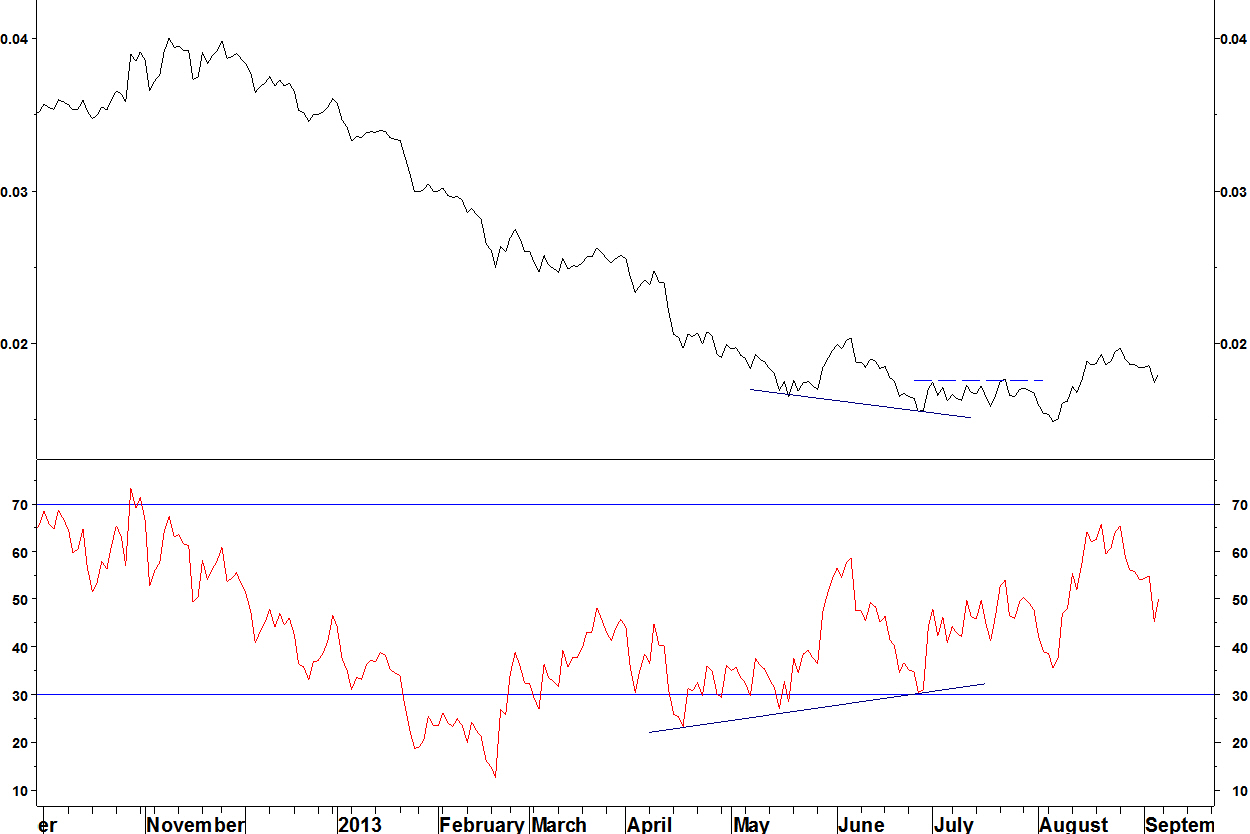
Exxon (XOM)

- The pair makes a new low with bullish divergences on the 14 week RSI and the PR
- There was a bullish set up in July 2010 and a bearish set up in April 2011 (dashed lines)
- Note the first doesn’t work immediately (two month delay) and the second peak was temporary, holding for eight months
Daily chart
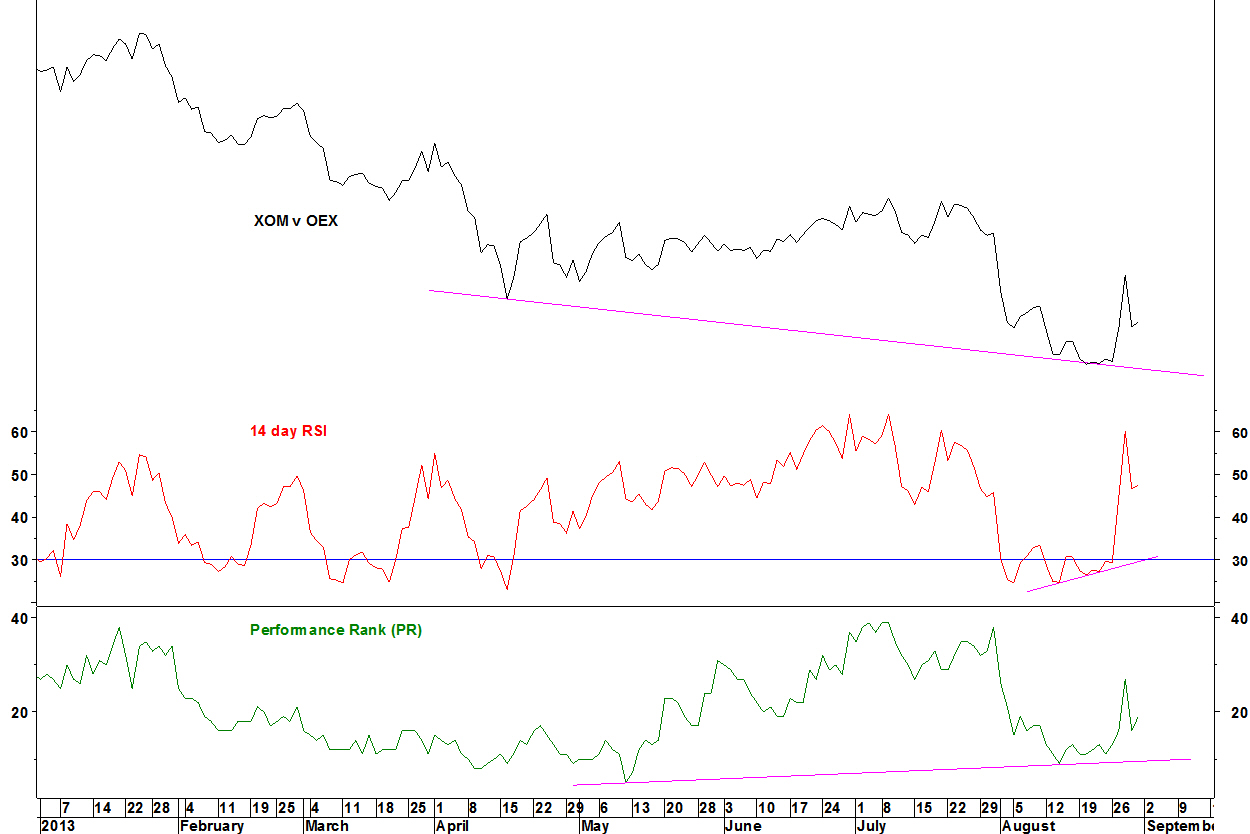
- There is bullish divergence against the April trough and within this trough, although the daily RSI never got above 30 at the low, as is ideal
3M Company (MMM)
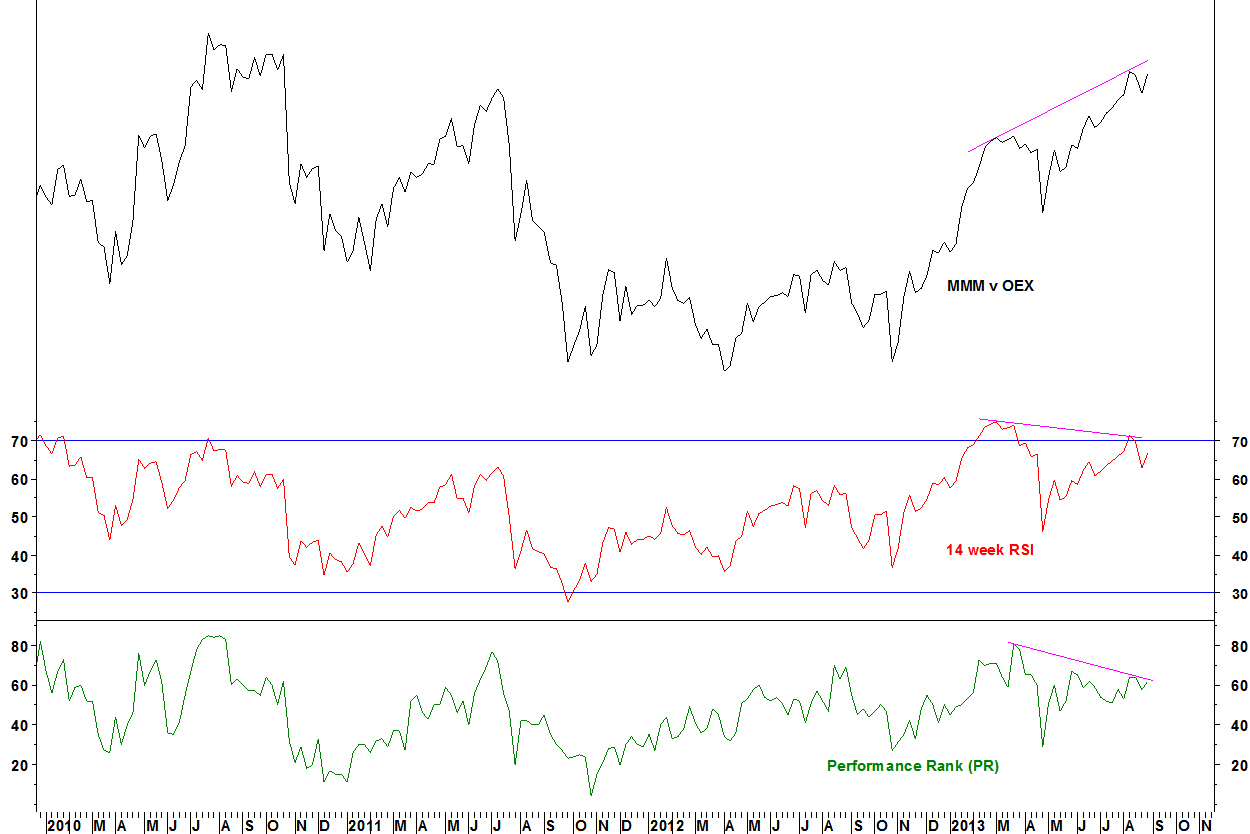
- Bearish divergence against the March high is shown on the 14 week RSI and the PR
Time Warner (TWX)
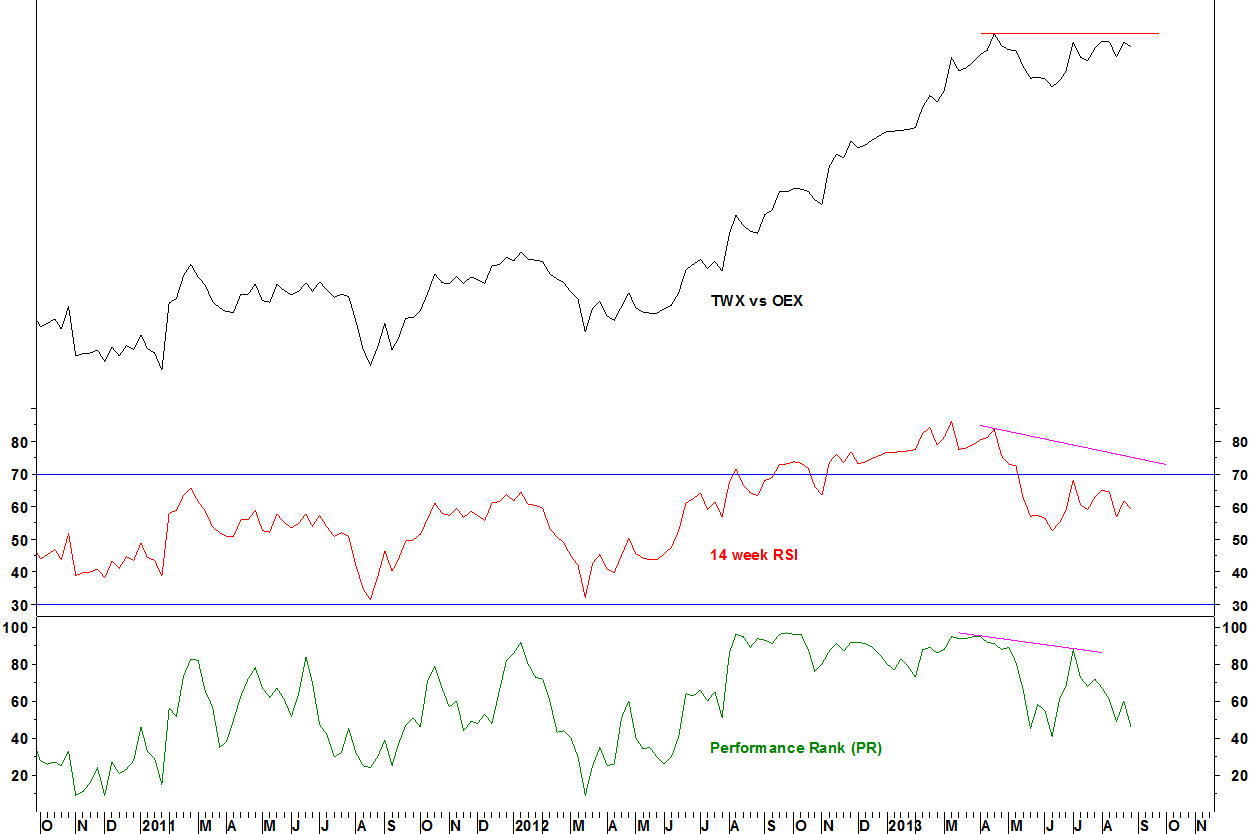
- This doesn’t have divergence yet but a new high and the RSI going above 70 would give a good set up.
Also setting up…
These stocks versus the S&P 100 Index have or are close to RSI divergences but their PR divergence is slight. I see pronounced PR divergence as better supporting evidence to an RSI divergence.
Bullish divergence: Exelon Corp (EXC)
Bearish divergence: Boeing (BA), Ford (F)
On 12 August, I set out entry criteria for a trade in the materials sector using my Performance Ranking (PR) method. This trade was entered on 15 August and now is around break even, give it time.
There are two more stocks from the SPDR Materials (XLB) on which PR method trades have set up. The method combines two factors
- Weekly RSI divergences for the stock against the ETF
- A PR divergence for the stock, when ranked against all ETF components
Owens Illinois (OI) vs SPDR Materials (XLB)

- A weekly RSI divergence has formed against the February 2013 peak
- A weekly MACD divergence has also formed
- The RSI has moved below the intervening low (purple arrow), an ideal entry condition for RSI divergence trades
- The PR had divergence at the peak and has fallen to 56 on its scale of 0 to 100, the lowest since December 2012
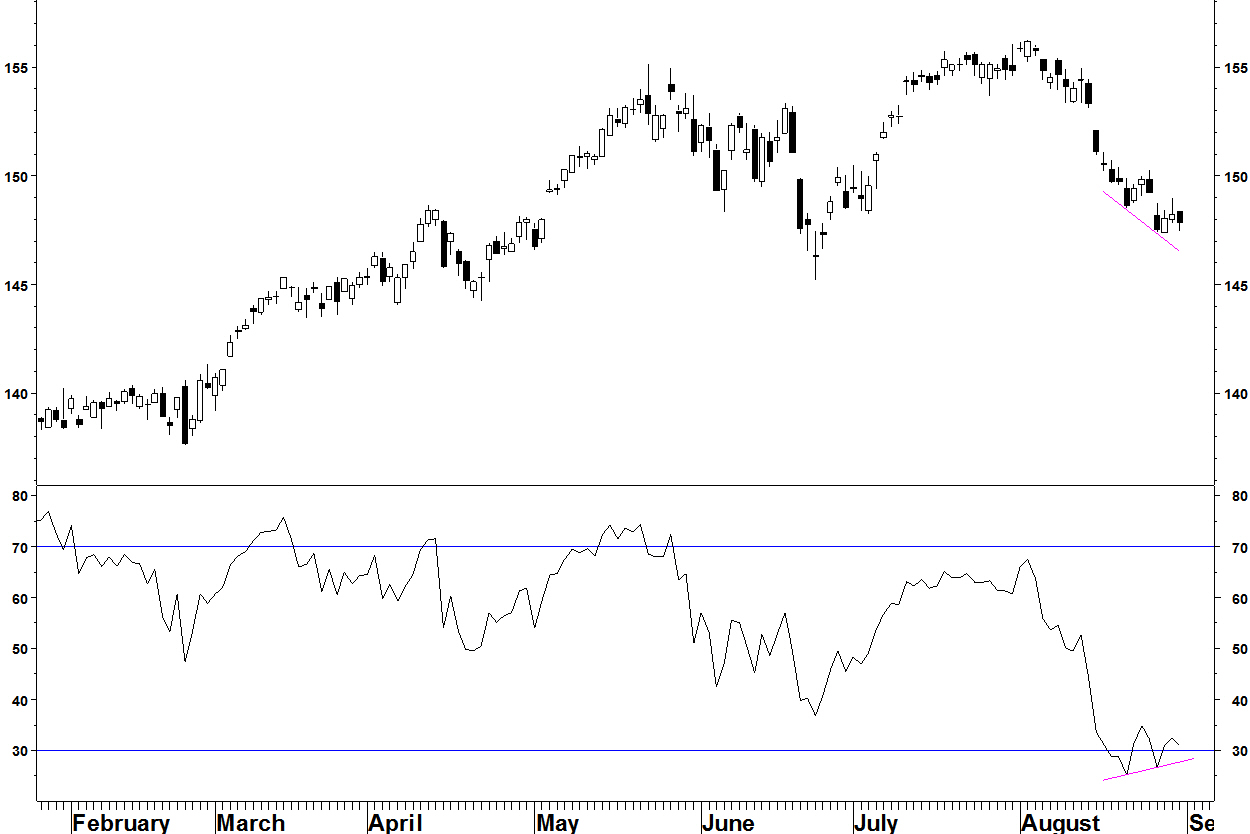
Daily chart
- The 14 day RSI set up with a divergence against the February high, first above 70 (20 March) and since then, below 70, matching my RSI divergence criteria
- The pair broke below the 25 July low (blue arrow) on Friday 30 August
A short position in OI against XLB is opened at Friday’s close of 0.7022, with the stop loss above the high of 0.74767 from 01 August, 6.5% higher.
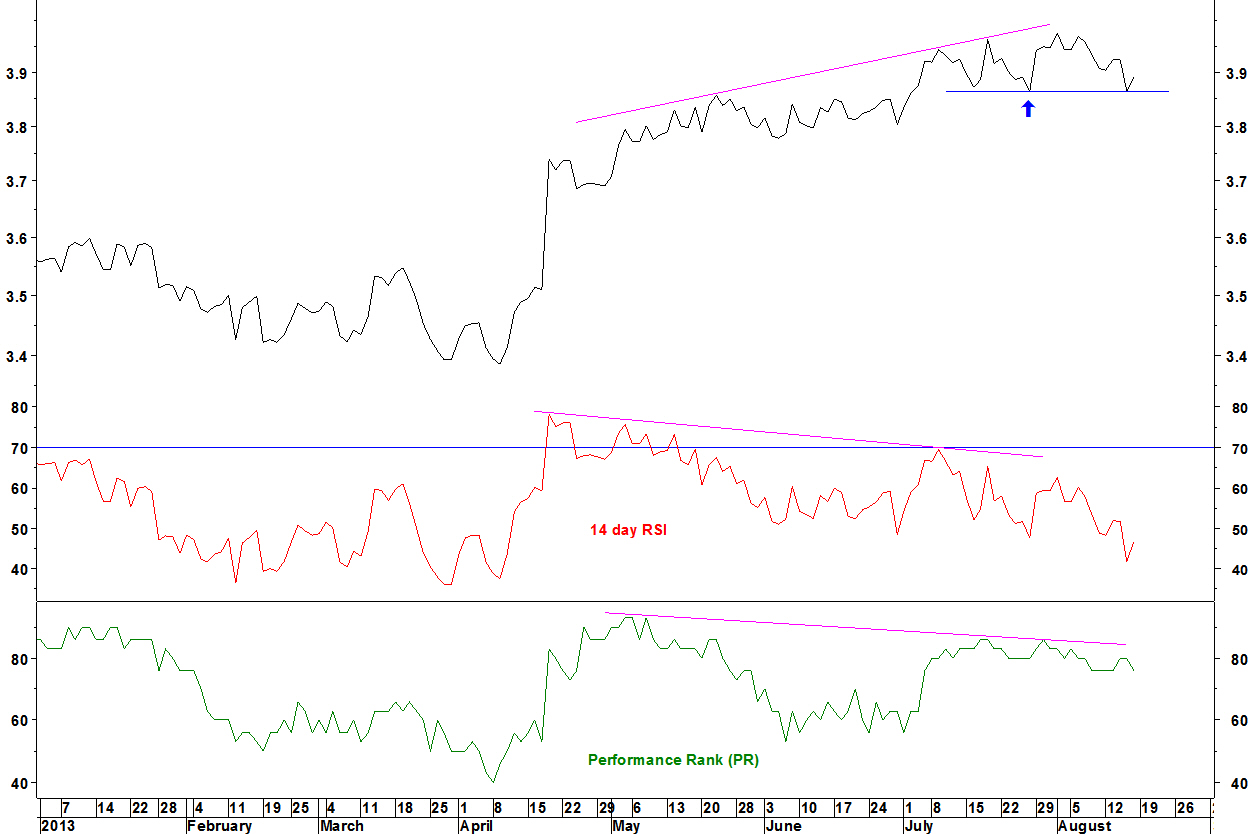
International Flavors & Fragrances Inc (IFF) vs SPDR Materials (XLB)
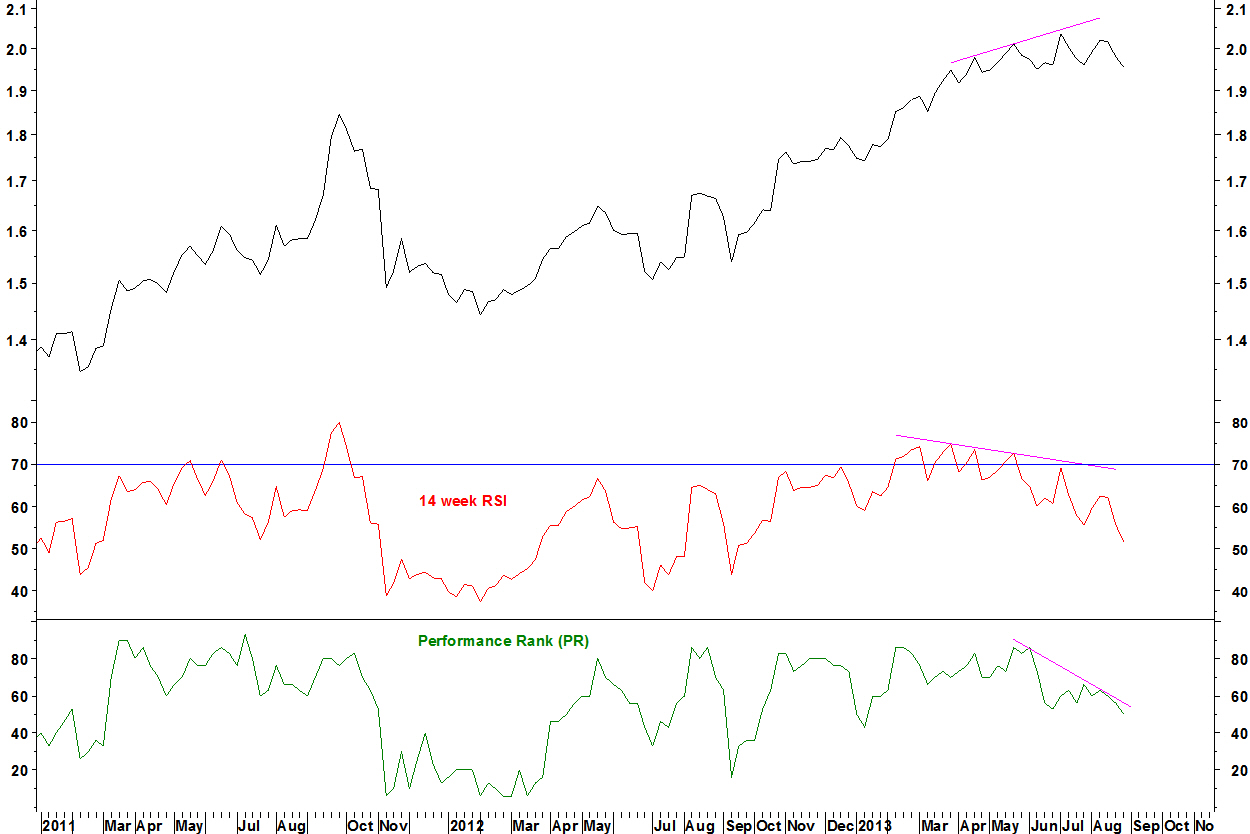
- An RSI divergence formed against the late March high and the intervening low was broken
- The PR divergence formed from early June until the pair made its high in early July
Daily chart
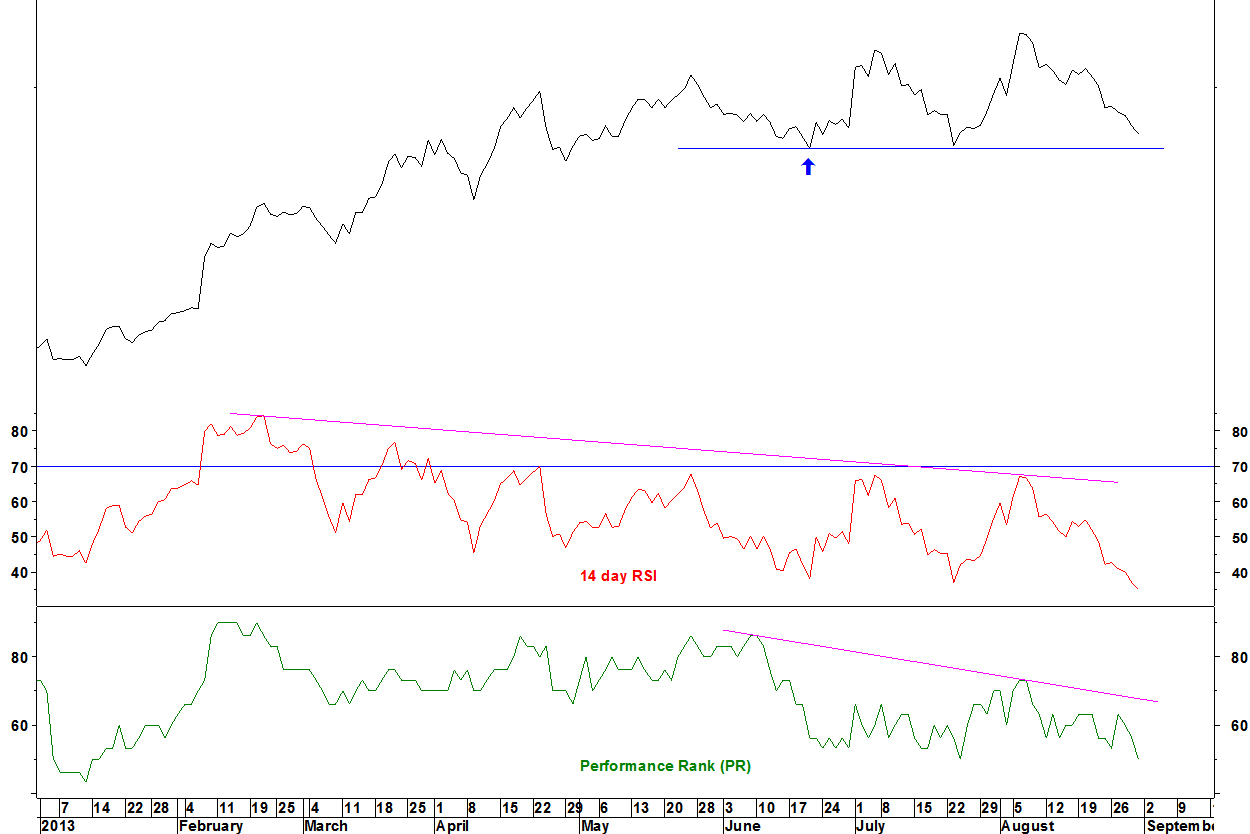
- The RSI formed divergence first above 70 (in March) and since then, below 70
- The entry signal is a break below the 20 June low (blue arrow). The stop loss will then be above the 06 August high (purple arrow), 5.8% higher
A short position in IFF v XLB will be opened on a break below the 20 June low.
In May 2012, I showed that daily RSI divergences can be a reason to remove positions but that only weekly RSI divergences are good enough for the entry criteria for RSI divergence trades. I followed this up in February 2013, showing how those ideas turned out.
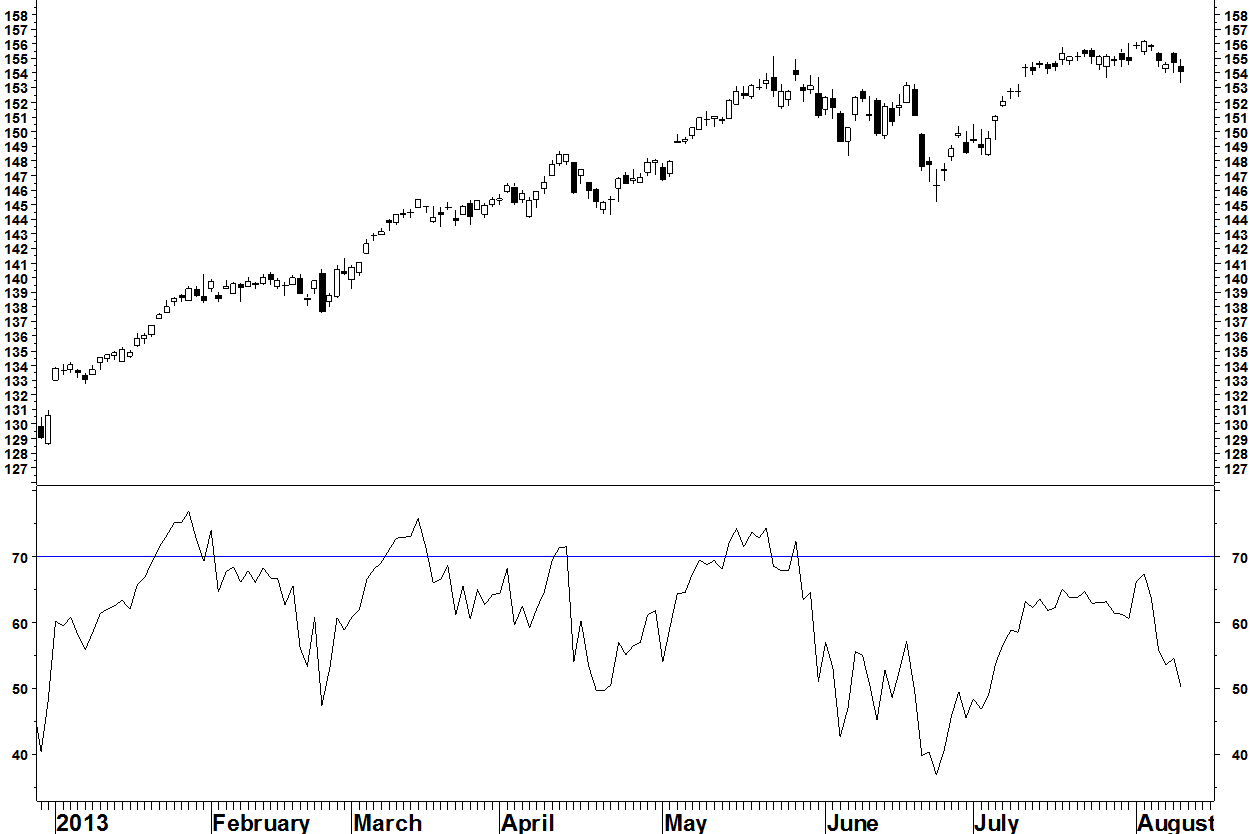
SPDR Dow Jones Industrial Average (DIA)
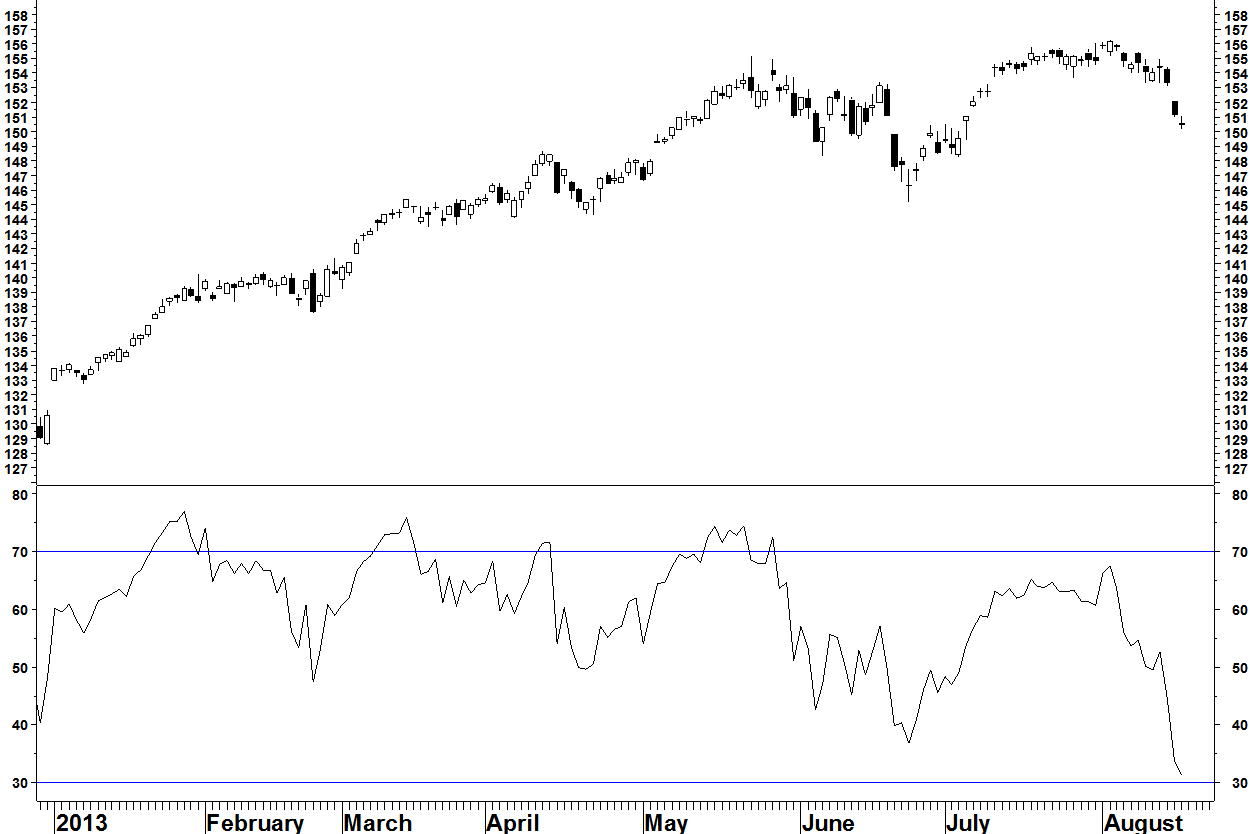
A short position in DIA was opened on 14 August at $153.32. This now has a bullish divergence on its 14 day RSI.
Therefore I will take half of this position off at Friday’s close of $147.85 for a 3.6% profit and move the stop loss to break even. Given the bearish weekly RSI divergence of early August, I’m still hoping for more downside from that eventually, so I’ll keep half of the position.
A) SPDR Dow Jones Industrial Average (DIA)
Last week, I set out the entry criterion for a short position in DIA of a close below $153.33. According to my data source (CSI’s Unfair Advantage – a good source for Metastock compatible data), DIA closed at $153.32 on Wednesday 14 August.
A short position for my trading record is opened at $153.32, which has a 1.8% profit so far. The weekly RSI and MACD divergences are rare events with reliable medium term consequences. Therefore I will trade it here on a medium term basis, keeping the stop loss above the high for now.
You may want to take some and stop loss to break even for money management and your trading style.
B) PPG Industries
Last week, I set out the entry criterion for a short position in PPG Industries (PPG) v SPDR Materials (XLB) of a close below the 26 July low of 3.86565 (blue arrow). On Thursday 15 August this was met.
A short position in PPG v XLB is opened at 3.8649, the closing ratio value on 15 August. The stop loss is a new high above 3.97597 from 01 August.
You can see that on Friday there was a slight rebound and the ratio has not conclusively broken down yet but I’ll stick with what I said for my trading record. You can wait for a more conclusive breakdown below the almost equal lows of 16 July, 01 August and 15 August to enter a trade.
C) Agnico Eagle Mines
On 08 July and then again on 29 July, I showed the set for a long position in Agnico Eagle Mines (AEM) v S&P 500 Index. Last week, I noted the improved commonality for gold stocks against the market. The entry criteria for this pair were met on Friday by a weekly close of the RSI above the intervening high, with the daily RSI above 30.
A long position in this pair is therefore opened. This signal came a week later than for some gold stock relative charts, so didn’t get the benefit of last week’s action.
The long position is opened at 0.0187217 (AEM = $31.00, SPX = 1,655.83)
The stop loss is a new low below 06 August of 0.014982. That is 20.0% lower, wider than I would have liked. It does show a relative turn around though and a new relative high since mid June.
D) XAU Index
On 01 July, I showed the entry set up for a long position in the Philadelphia Gold & Silver Index (XAU). On 29 July, I showed this was fulfilled and a long position was opened at 94.82. At 109.27, this position has a gain of 15.2%.
I effectively have two Gold stock v the market positions now, (long XAU, short DAI, long AEM v SPX). I will take the profit in this long XAU position to remove this duplication. XAU is closed at 109.27.
E) Bank of America (BAC) v Union Pacific (UNP)
Shown last week, this set up consolidates below its breakout level.
Last week, I showed the weekly RSI and MACD divergences on the SPDR Dow Jones Industrial Average (DIA).
The daily RSI criteria were not quite met but nor were they on any other market or sector ETF. Weekly criteria (which are more important) were met on many series.
SPDR Dow Jones Industrial Average (DIA)

There has been a weekly reversal bar, which was one possible entry method stated. This has a tighter stop loss than obtainable from a move below the intervening weekly RSI low.
Daily chart
A daily close below Friday’s low of $153.33 will be a clearer indication of a top than we currently have. Then, a short position will be opened with a stop loss above the 02 August high of $156.24.
Gold
The position in the Philadelphia Gold & Silver Index (XAU) has recovered and the stop loss is moved to break even. The entry signal for the pair involving Agnico Eagle Mines (AEM) was not triggered last week. It will likely be met this week, given today’s action in gold. There is now much better commonality of these signals for gold stocks relative to the S&P500 Index than a few weeks ago.
Coal and coal stocks
The bullish divergence set ups anticipated in February and followed up on in June have now set up. These are backed up by the coal price having a bullish weekly RSI divergence.
I will revisit this soon but coal stocks are a buy relative to the S&P500 Index. Only the entry criteria and whether to wait for a pull back remain as questions.
Last October, I showed a long term moving average crossover forming for the pair of Philadelphia Banks Index (BKX) vs. S&P Railroads Index. The updated chart is shown below, with the vertical line dated as of last October’s posting.
Philadelphia Banks Index (BKX) vs. S&P Railroads Index

Long term, nothing has changed about this chart. The crossover remains in place (shown by the MACD remaining above zero) but the pair has gone sideways for ten months. These are not a timing tool. The pair tests its March 2012 high and could move to a new high since April 2011.
Here is one possibility for getting quicker working trades from these long term rotations: Employ the Bollinger Band breakout criteria to stock pairs from these sectors.
Bank of America (BAC) v Union Pacific (UNP)
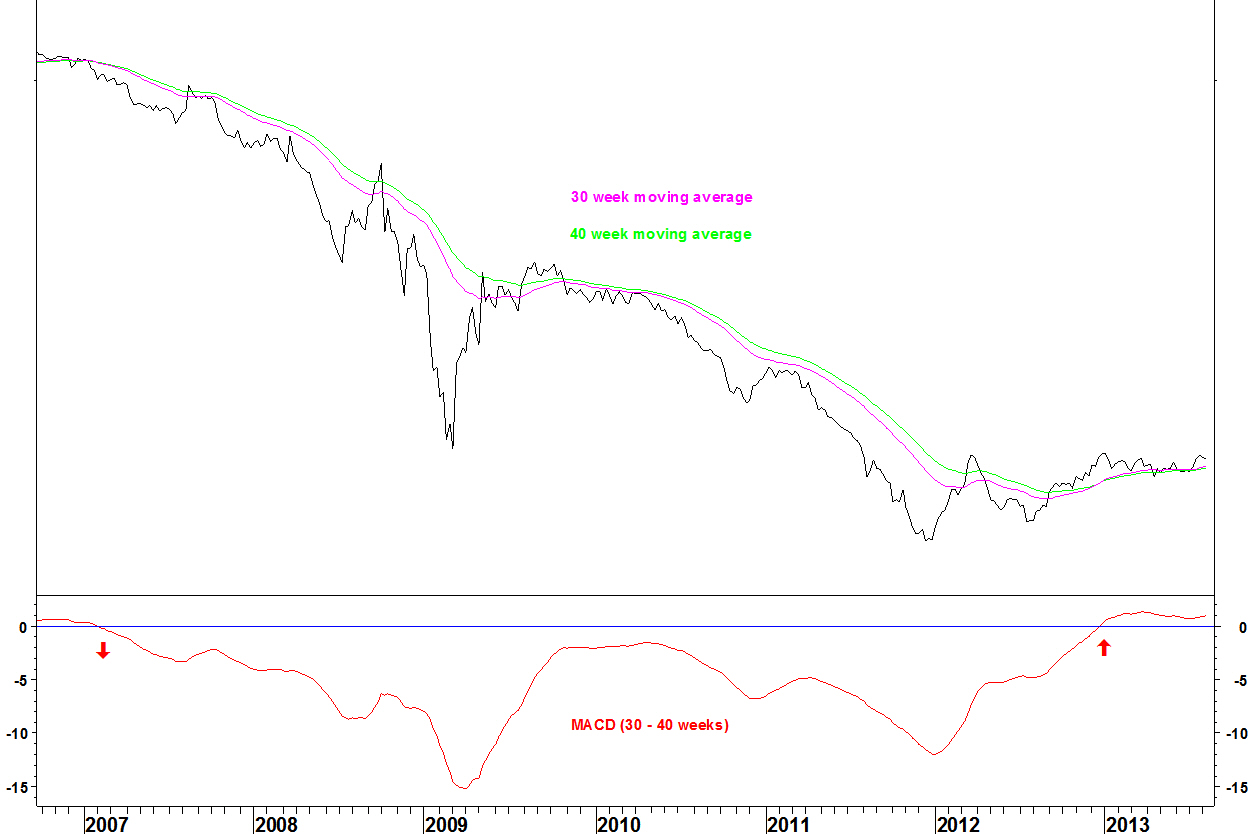
The 30 and 40 week moving averages crossed in February 2007 then again in December 2012
Like the sector pair, it has traded sideways during 2013
Bollinger band chart
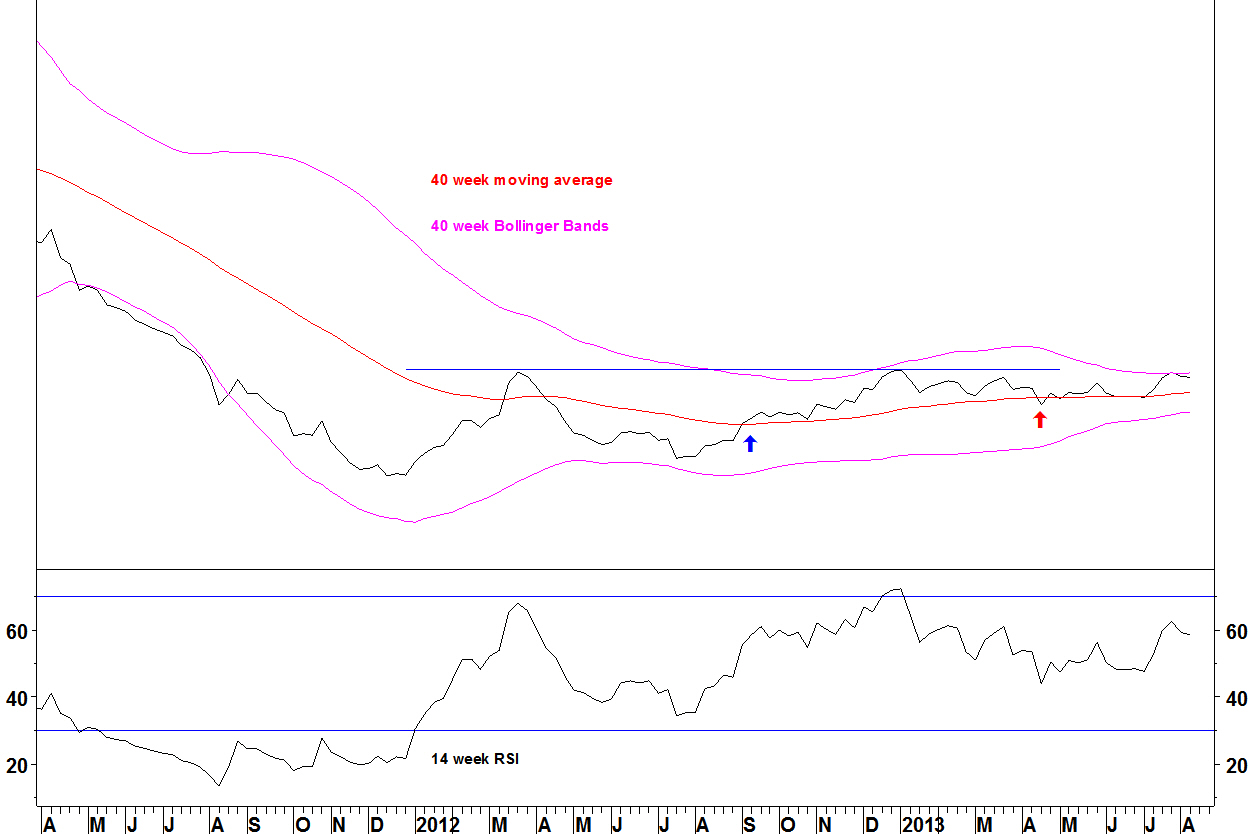
The ratio has the tightest bands since 2005 – meeting the three year rule
The 40 week moving average turned higher in September 2012 (blue arrow)
The ratio tests the upper band. A break higher will break the highs of March 2012 and January 2013, making a new high since July 2011
The buy signal is a weekly close above the upper band with an expansion of the band width. On this, I will open a long position in the pair with initial stop loss below the April 2013 low (red arrow).
Previously, I have used Bollinger Band breakouts for mid trend positions. I’ll see how this works for breaks above long term bases.
My long term moving average crossover method looks for price or pair charts where there has been no moving average crossover for over four years. These crosses show long term changes but are not a timing tool.
In April, I showed Washington Post (WPO) v SPDR Consumer Discretionary (XLY) with a long term base crossover. This pair has a 18.8% gain since then.
Washington Post (WPO) v SPDR Consumer Discretionary (XLY)
Even so, the pair fell for one month before taking off. Meanwhile, the pair of Kimco (KIM) v Post Properities (PPS), shown in March, has been higher and lower and now is little changed, all within its long term base.
These set ups are therefore best suited to long term asset allocations than to trades, for which I prefer defined set ups being met by the best stock candidates.
One possibility is using a Bollinger Band breakout method on consolidations above bases. I tried this on the sector pair of chart of Philadelphia Banks Index (BKX) vs. S&P Railroads Index last year, without a conclusive breakout occurring.
That was a daily chart, and my Bollinger Band criteria require the tightest bands in three years on the weekly chart to have the best chance of working. I will use those criteria now to try to form a practical trade from these long term moving average crossovers.
