Pairs trade: Exxon Mobil (XOM) v Time Warner (TWX)
We can always examine pairs from the Price Ranking (PR) candidates to see whether they match the RSI divergence entry criteria. Here is one that does.
XOM v TWX weekly chart
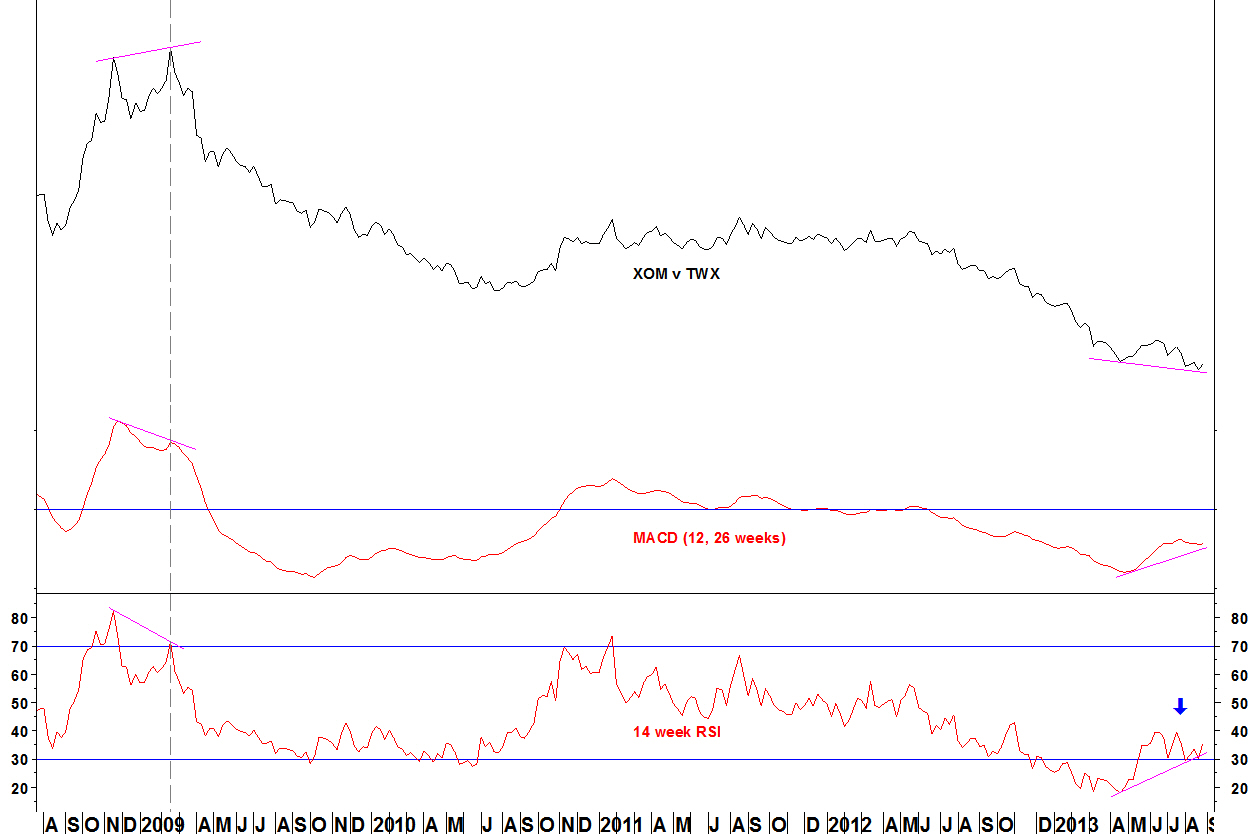
- The previous divergence set up marked the February 2009 peak
- There is bullish divergence on the MACD and the 14 week RSI
- An RSI buy signal is a move above the intervening RSI high of 39.6 from 19 July (blue arrow)
- The RSI divergence entry criteria state preference for a weekly RSI close above the intervening high, which could delay the entry but makes it a safer trade
XOM v TWX daily chart
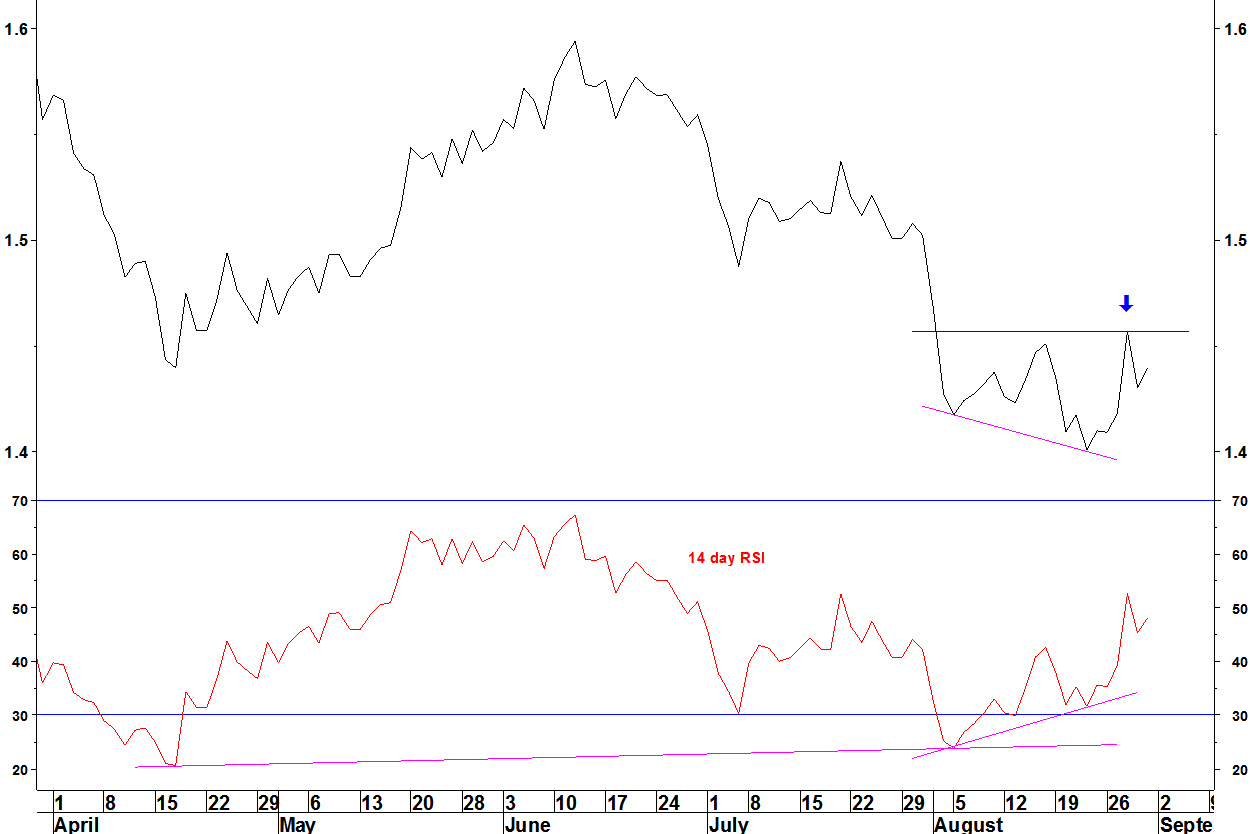
- There is divergence against the April trough and within this trough
- The low of 22 August came with RSI above 30, meeting the daily RSI entry criteria
- A move above the 28 August high (blue arrow) will be a high since 01 August
A long position will be opened in this pair on two conditions:
- A close for the 14 week RSI above the intervening high
- A move above the 28 August high
The stop loss will be below the 22 August low, 3.8% below the 28 August high.
Leave a Comment
