RSI divergence ideas: how they turned out
18 February
In April and May 2012, I showed some charts with weekly RSI divergences. This set up occurs rarely and on most occasions, marks a pause in the trend and a significant retracement. I can scan for this set up across hundreds of stocks, commodities, currencies and indices. Obviously, there are more occurrences for stocks when the market indices have this set up. 1 Natural Gas: Shown on 10 April
- Natural Gas was at $2.29 on 10 April. It fell until 18 April (making a daily RSI divergence also)
- It rallied to $4.07 on 19 October
- The October peak did not have a weekly RSI divergence but there was a daily RSI divergence
- You’ll see in my methods section how I use daily RSI divergences for taking positions off but not for opening them
2 Euro v US Dollar: Shown on 28 May

- The Euro v US Dollar chart was shown having a daily RSI divergence but without a weekly RSI divergence
- The posting showed what had occurred at a previous similar situation
- Exactly the same thing followed: a rally before a new low was formed, this time in July 2011
- A bullish weekly divergence was formed (albeit on the 9 week RSI, moving the goal posts a little) and this marked a longer term low
3 Emerging Markets ETF (EEM): Also shown on 28 May

- This was shown with a daily divergence but no weekly divergence but this still marked the low
- Although this particular daily RSI divergence worked as an entry point, there was a retest in early June. It was almost two months before a sustained move started
4 T Bond yields: Possibility shown on 30 May and occurrence on 11 June
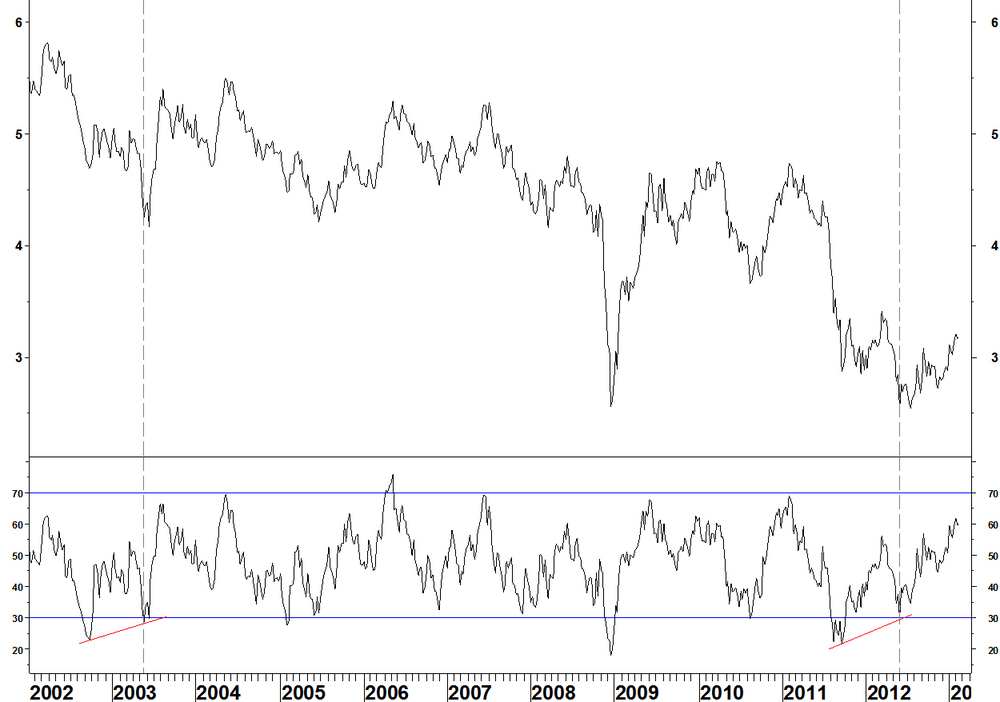
- The previous bullish weekly RSI divergence was in 2003
- The final low was made on 25 July
- From the weekly divergence to now, yield has rallied from 2.54% to 3.18%
Summary
- Weekly RSI divergences have a good record of marking turning points
- Sometimes, the turn can take a few months to get moving
- Daily RSI divergences are less reliable at marking long term turns but still should be heeded in shorter term trading

Trackbacks & Pingbacks