Banks v railroads: Long term moving average crossovers revisited
Last October, I showed a long term moving average crossover forming for the pair of Philadelphia Banks Index (BKX) vs. S&P Railroads Index. The updated chart is shown below, with the vertical line dated as of last October’s posting.
Philadelphia Banks Index (BKX) vs. S&P Railroads Index

Long term, nothing has changed about this chart. The crossover remains in place (shown by the MACD remaining above zero) but the pair has gone sideways for ten months. These are not a timing tool. The pair tests its March 2012 high and could move to a new high since April 2011.
Here is one possibility for getting quicker working trades from these long term rotations: Employ the Bollinger Band breakout criteria to stock pairs from these sectors.
Bank of America (BAC) v Union Pacific (UNP)
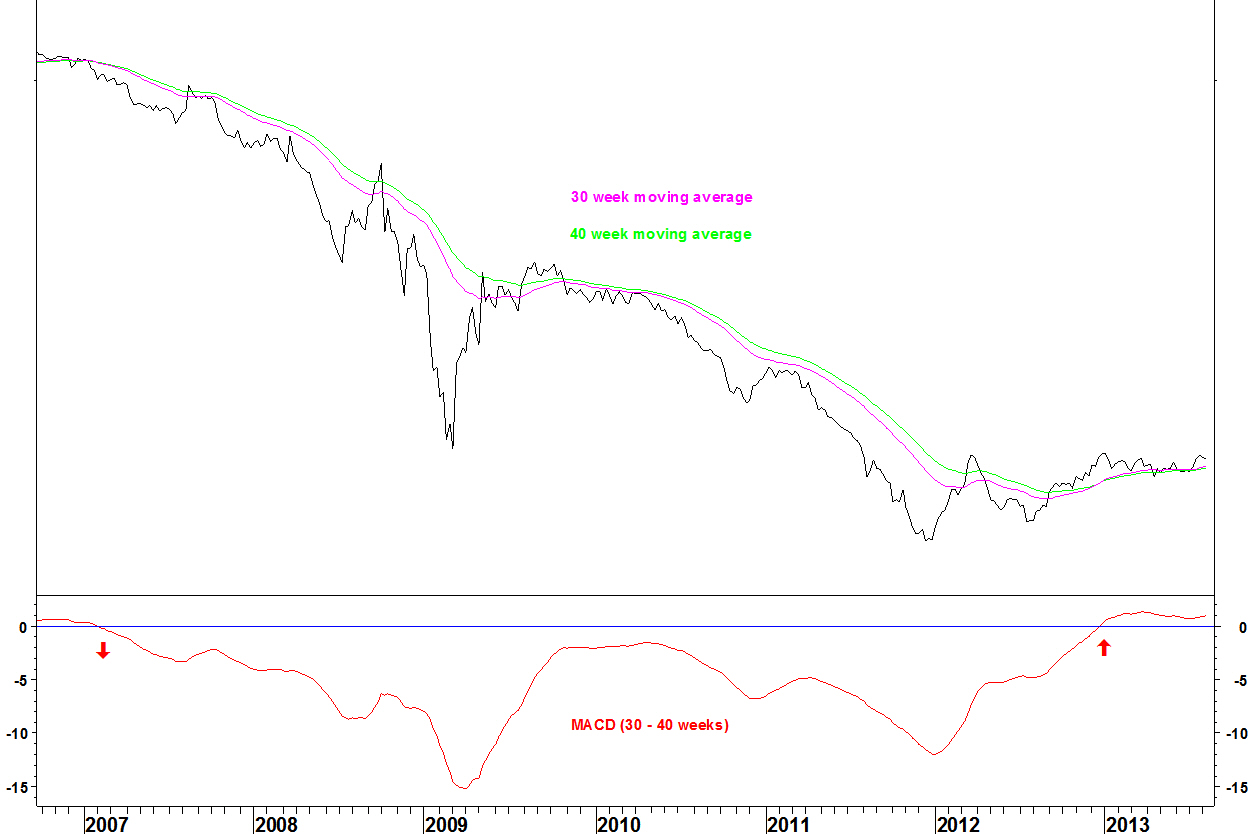
The 30 and 40 week moving averages crossed in February 2007 then again in December 2012
Like the sector pair, it has traded sideways during 2013
Bollinger band chart
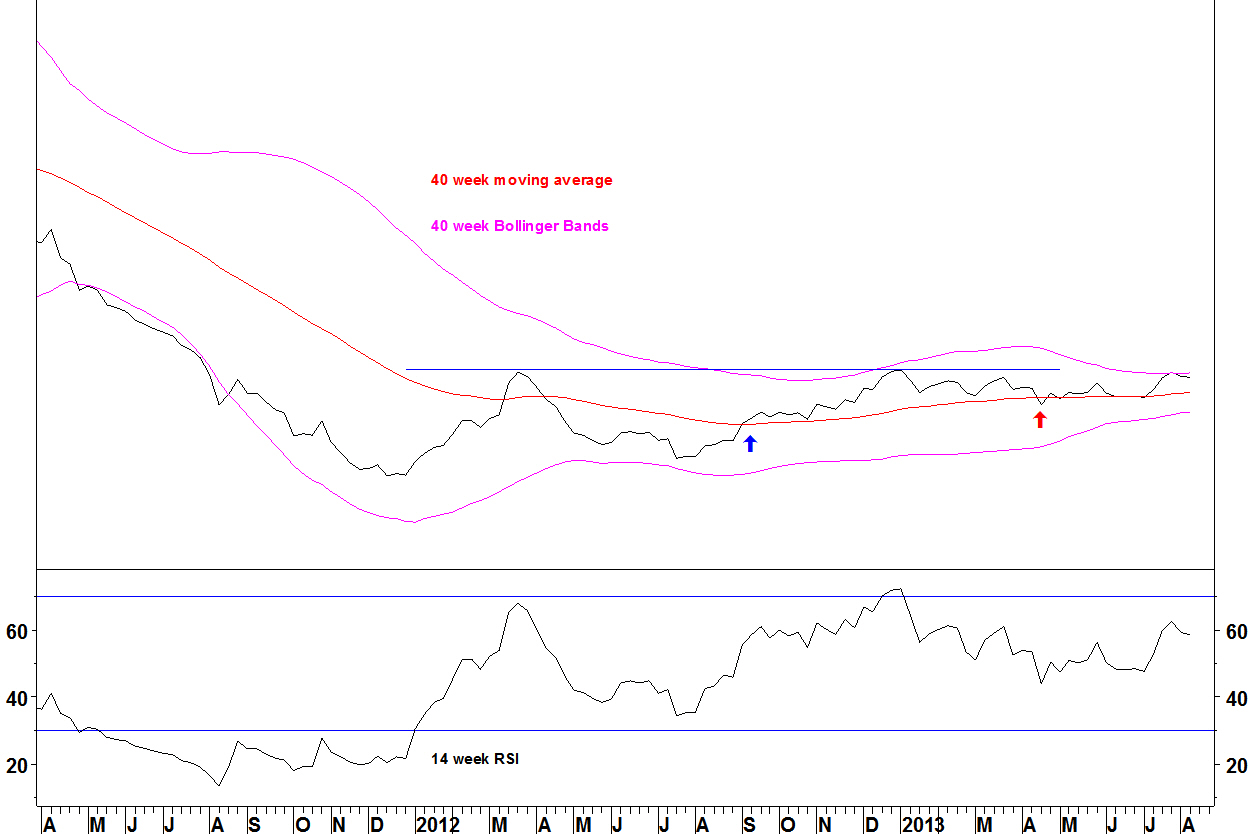
The ratio has the tightest bands since 2005 – meeting the three year rule
The 40 week moving average turned higher in September 2012 (blue arrow)
The ratio tests the upper band. A break higher will break the highs of March 2012 and January 2013, making a new high since July 2011
The buy signal is a weekly close above the upper band with an expansion of the band width. On this, I will open a long position in the pair with initial stop loss below the April 2013 low (red arrow).
Previously, I have used Bollinger Band breakouts for mid trend positions. I’ll see how this works for breaks above long term bases.
