25 February
On 28 January, I showed how the components of the Philadelphia Gold & Silver Index (XAU) were nearing oversold on breadth, measured by the % of stocks above their 200 day moving average. Last week, this %age fell to zero, matching occurrences in 2000, 2008 and 2012.Philadelphia Gold & Silver Index (XAU) and % above 200 day moving average
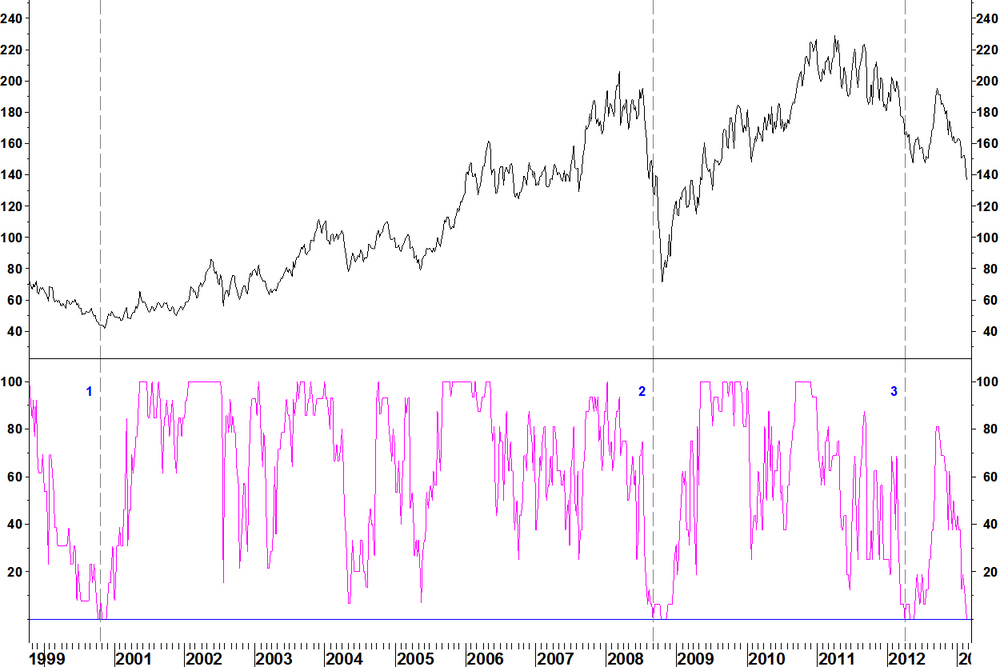
In these three years, price lows for XAU were formed with oversold breadth but not immediately on reaching oversold.

With breadth having only just reached oversold, the table suggests that we should expect to wait at least five weeks for a price low.
That doesn’t rule out gold stocks starting to perform better on a relative basis, if the rest of the market is falling. Last week I showed the possibility for Newmont Mining (NEM) to start outperforming. Newmont Mining (NEM) vs S&P500 Index
There still just about has a bullish divergence against the April 2012 low, but the set up on the daily chart has been blown by a move of the RSI back below 30. I’ll continue to look for a good set up on gold stocks on price and relative strength to coincide with the breadth low but the table above suggests there is no hurry.
I showed one such example on last April involving Agnico Eagle Mines (AEM). On 28 May, I closed the trade, making a 25.3% profit. You can see a record of my trades on the About me page.18 February
Here is a sector pair chart that I regularly view: Morgan Stanley Consumer Index (CMR) v Morgan Stanley Commodity Related Equity Index (CRX)
- The 40 week Bollinger Bands are their tightest for three years, with the ratio having traded sideways since June 2012
- The 40 week moving average trends up
- I am watching for an upside breakout, in the direction of the moving average, as per my entry criteria
ETFs for this trade set up in a the same way (IYK & XLP on the long side, XME & EWZ on the short side).
If the commodity sector breaks down on relative strength with good commonality, this trade is worth looking at. One slight concern, and they only form a small part of the commodity sector, is that gold stocks are oversold on relative strength. I have shown recently how gold stocks are nearing oversold on breadth. They continue to fall to a long term oversold level but are not there yet. One relative chart sets up now with a trade though. Newmont Mining (NEM) v SPDR S&P500 Index (SPY)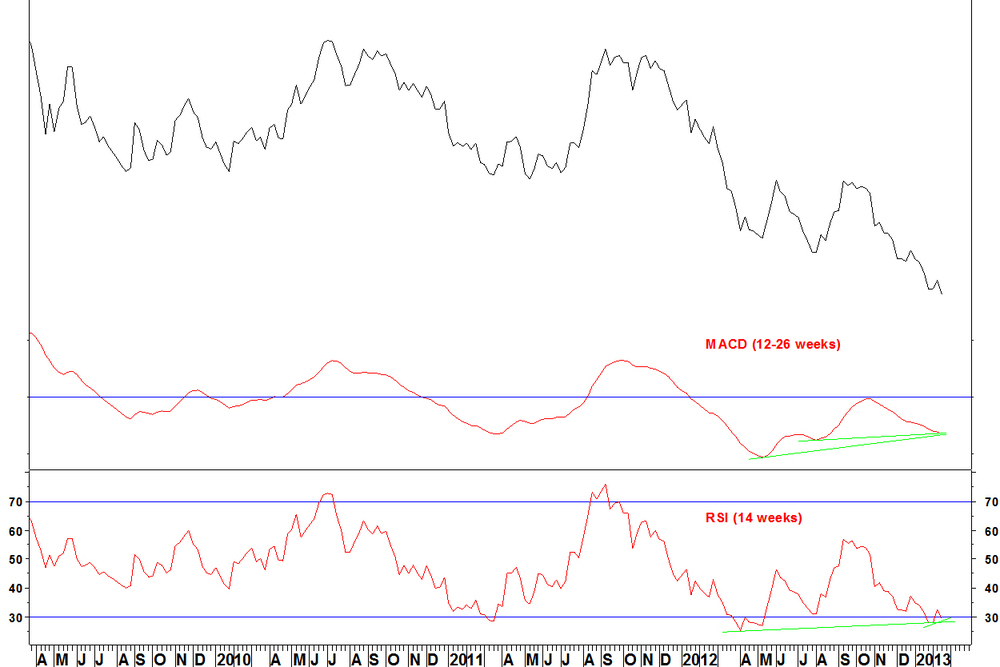
- A weekly RSI divergence is in place within this trough (vs. the January low) and across troughs (vs. the May 2012 low)
- MACD divergence is in place against the May and August 2012 lows
Daily chart

- The ratio has halved since November 2011 (red arrow)
- A divergence formed in January
- Another divergence (there is a fractional new relative low) has formed, this time above 30, meeting my RSI divergence criteria
Position entry
As stated on my methods page, the position is entered on an end of week close for the RSI (on the weekly chart) above the intervening high. That is an RSI of 32.6 from 08 February. The stop loss was stated in the methods as a move back into oversold for the RSI, but as this doesn’t define a level for the trade itself. I think it is better to set the stop loss as a new low for the ratio.
18 February
Divergences between price and an indicator often mark extremes. I look for weekly RSI divergences and separately, for breadth divergences. When these coincide, that strengthens the case for a reversal. SPDR Health (XLV): Breadth divergence XLV and %age of component stocks above their 100 day average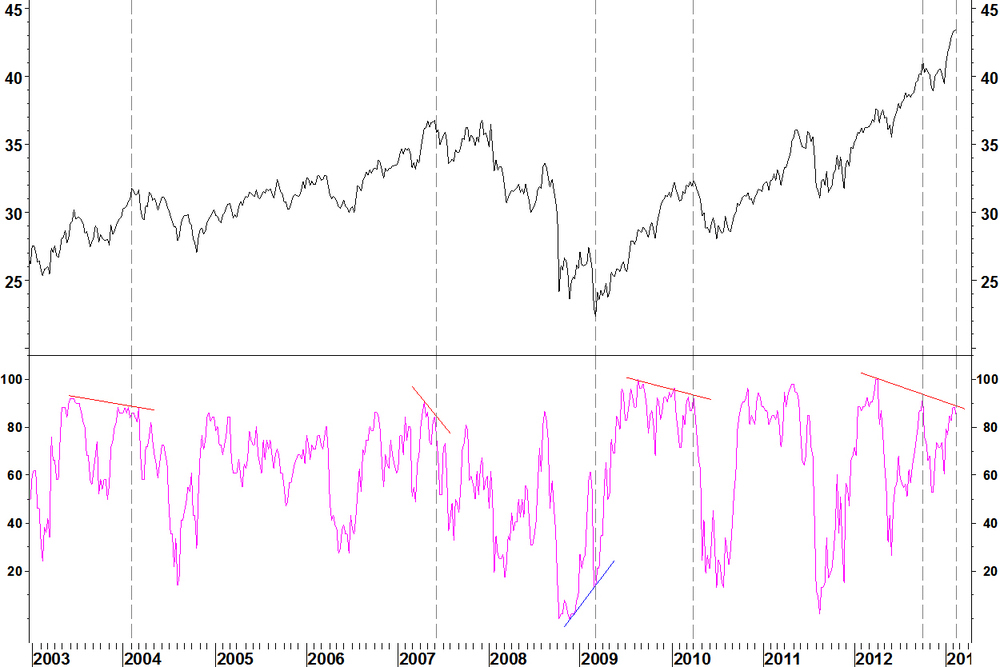
There is a decent record of breadth divergences marking extremes over the last 10 years.
- A lower breadth high formed at the February 2004 high, leading to a price low in October 2004
- A lower breadth high formed in June 2007. There was a retest in December 2007 (price fractionally lower, breadth much lower)
- A higher breadth low formed in March 2009 at the low
- Breadth divergence formed in January 2010 at the high. The April 2010 retest had lower breadth still
Now..
- Breadth peaked in April 2012. A price high formed in October 2012 on a divergence
- The latest price high has breadth divergence against the October high
SPDR Health (XLV): RSI divergence
- XLV has a weekly RSI divergence
- There is no MACD divergence, which would be ideal
Daily chart
- The first divergence (above 70) came on 01 February, which failed to hold the advance
- Another divergence has formed (below 70 this time), meeting my RSI divergence criteria
Entry criteria
The entry signal is a weekly RSI close below the intervening low but at times, a weekly reversal bar can be taken. Now is a time to make that exception. With the intervening RSI low at 51 from mid November, a large move is required, spoiling the risk:reward of the trade. A weekly reversal bar is a Friday close below last week’s low of $43.09. Then, a short position will be taken with a stop loss above the high ($43.45). Mining sector recap In October, I showed a hindsight example of the above using the mining sector. SPDR Metals & Mining (XME)
- The price low from the July breadth divergence has held for now but the rally has been modest
- The breadth indicator has unwound from oversold
- Many components have crossed their falling 200 day moving average through the passing of time, just like XME
18 February
In April and May 2012, I showed some charts with weekly RSI divergences. This set up occurs rarely and on most occasions, marks a pause in the trend and a significant retracement. I can scan for this set up across hundreds of stocks, commodities, currencies and indices. Obviously, there are more occurrences for stocks when the market indices have this set up. 1 Natural Gas: Shown on 10 April
- Natural Gas was at $2.29 on 10 April. It fell until 18 April (making a daily RSI divergence also)
- It rallied to $4.07 on 19 October
- The October peak did not have a weekly RSI divergence but there was a daily RSI divergence
- You’ll see in my methods section how I use daily RSI divergences for taking positions off but not for opening them
2 Euro v US Dollar: Shown on 28 May

- The Euro v US Dollar chart was shown having a daily RSI divergence but without a weekly RSI divergence
- The posting showed what had occurred at a previous similar situation
- Exactly the same thing followed: a rally before a new low was formed, this time in July 2011
- A bullish weekly divergence was formed (albeit on the 9 week RSI, moving the goal posts a little) and this marked a longer term low
3 Emerging Markets ETF (EEM): Also shown on 28 May

- This was shown with a daily divergence but no weekly divergence but this still marked the low
- Although this particular daily RSI divergence worked as an entry point, there was a retest in early June. It was almost two months before a sustained move started
4 T Bond yields: Possibility shown on 30 May and occurrence on 11 June
- The previous bullish weekly RSI divergence was in 2003
- The final low was made on 25 July
- From the weekly divergence to now, yield has rallied from 2.54% to 3.18%
Summary
- Weekly RSI divergences have a good record of marking turning points
- Sometimes, the turn can take a few months to get moving
- Daily RSI divergences are less reliable at marking long term turns but still should be heeded in shorter term trading
11 February
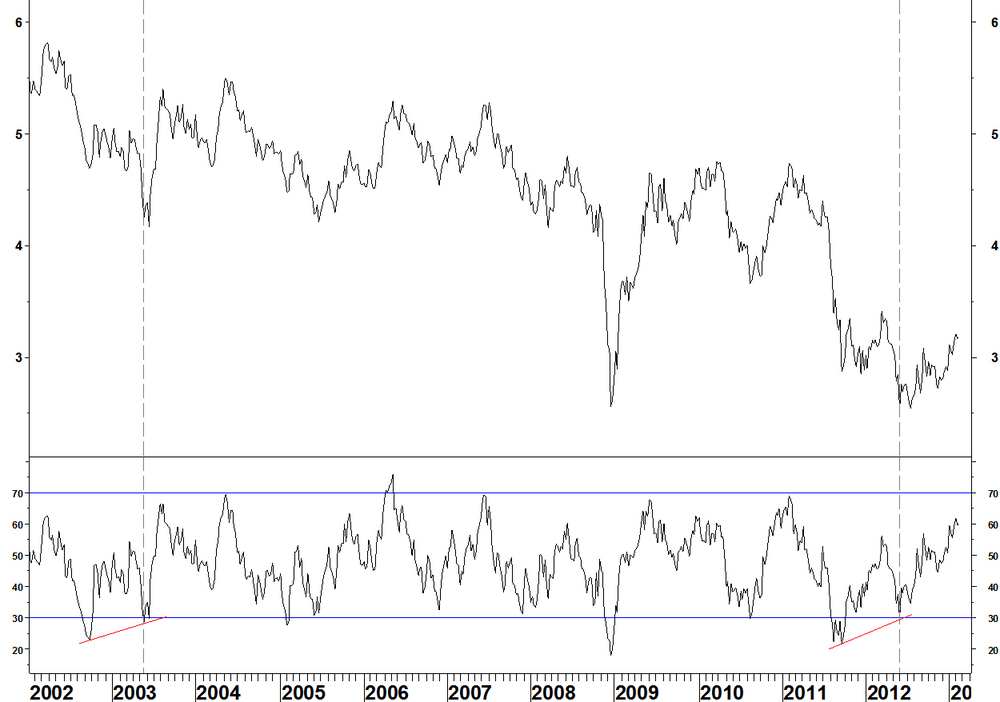
The Dow Jones Coal Index made a peak against the S&P500 Index in March 2011. Since then the relative strength line has fallen by 73.2%. Dow Jones Coal Index v S&P500 Index
In recent months, it showed some suggestions of basing but it was not an ideal set up. Now, a much more ideal set up is a possibility, one that could meet my RSI divergence criteria.
If the relative chart can continue down, make a new low and form bullish RSI and MACD divergences, that would be a good point to look to buy coal stocks on a relative basis. Looking at other sectors against the coal sector, there is good commonality of this set up. Even against the broader energy sector, the set up is the same. Dow Jones Coal Index v SPDR Energy (XLE)
One of the coal stocks, Arch Coal (ACI), has already made a new low against the S&P500 Index.
Arch Coal (ACI) v S&P500 Index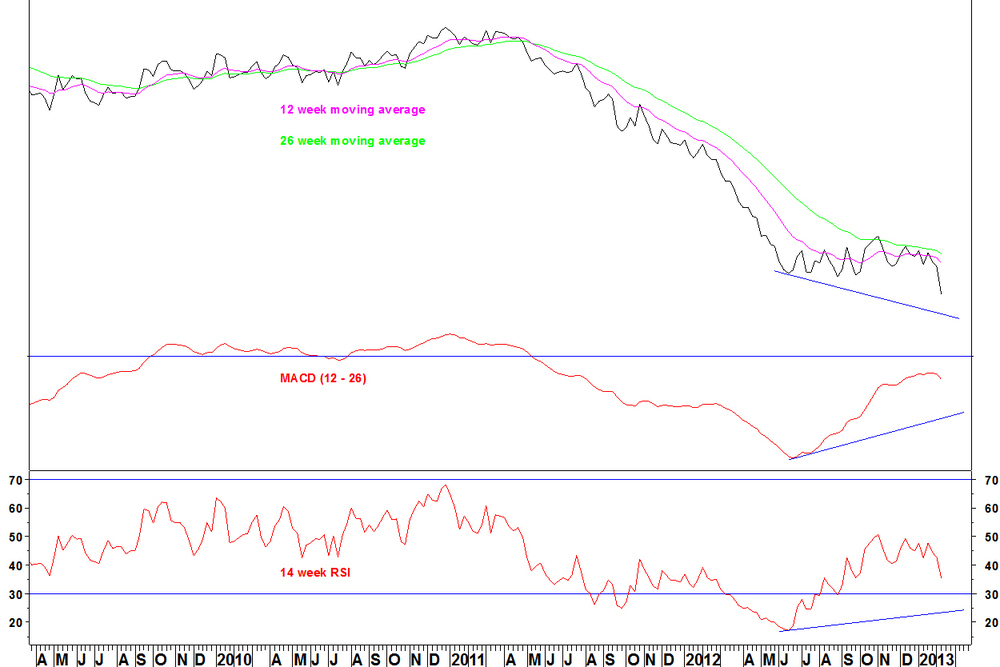
I want to see the RSI go below 30 for a divergence signal, then I can look at the daily chart for an entry signal.
On price, ACI made a new weekly closing low. I’d like to see it move below the summer 2012 low of $5.11 and RSI to go below 30, then look at the daily chart for an entry. Arch Coal (ACI) weekly price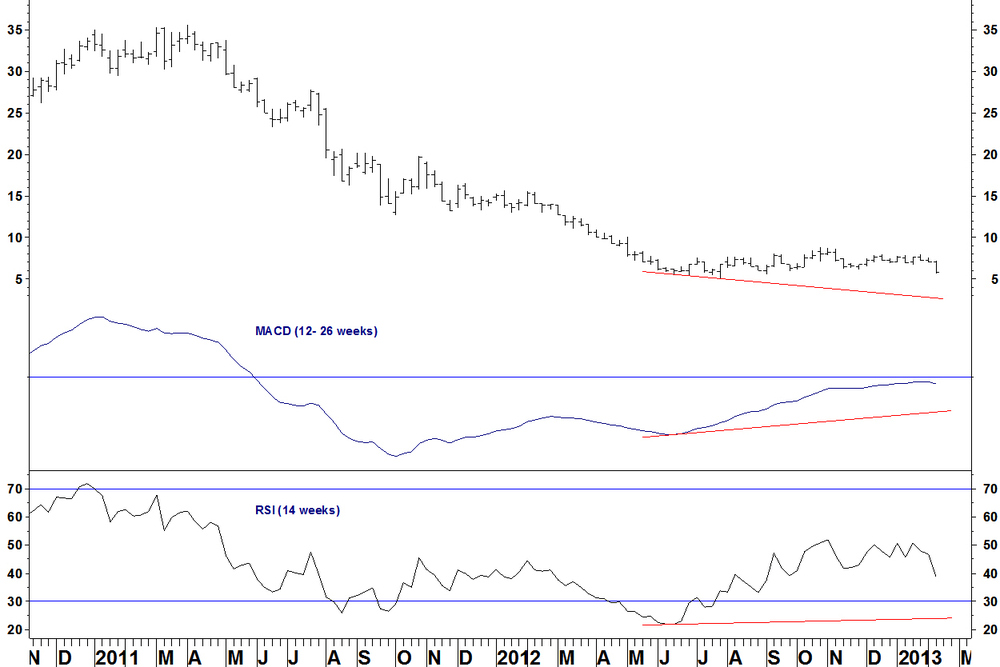
10 February
My RSI divergence criteria require a weekly divergence for a trade to be justified, which is not the case here. However, it is worth noting these daily RSI divergences. Topix Index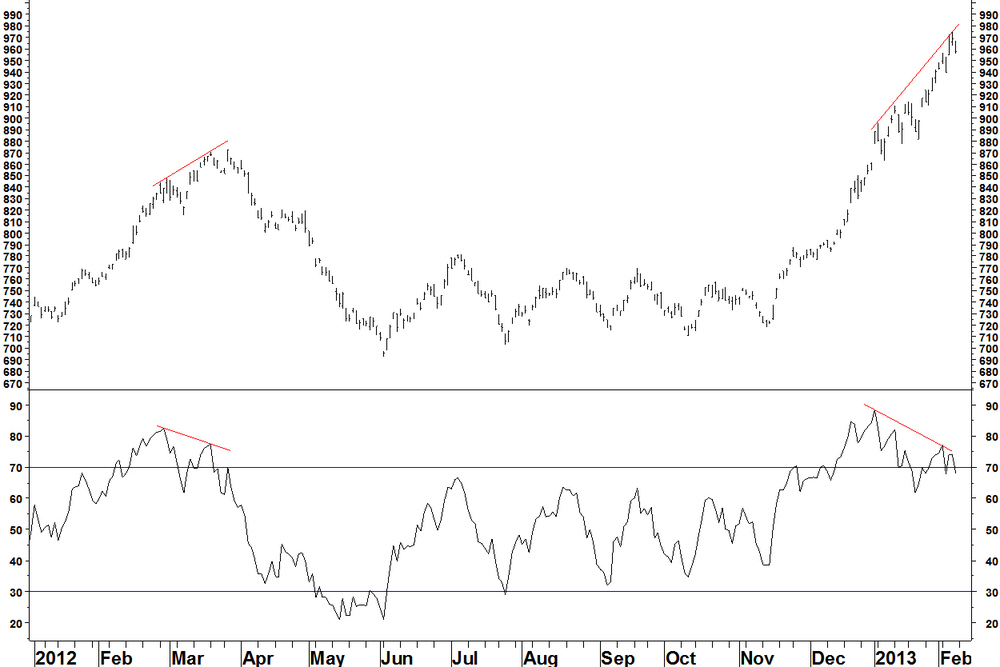
- A daily RSI divergence has formed, as was the case in March 2012
- The March 2012 divergence led to a two month decline of 20%
- There was also a daily divergence in February 2011 (just before the earthquake – spooky!)
- There were also daily divergences in January 2010 and April 2010, leading to a one month pullback and the high for the index since the 2009 low
US Dollar v Yen
- A daily RSI divergence has formed, as was the case in March 2012
- In March 2012, the end of the rallies in the Topix and the in USD v JPY were quite close
- The fortunes of the Yen have a significant impact on the Topix. With both showing daily RSI divergences, it is time to take profit if you’ve been in these trades
US Dollar v Yen and 50 week moving average
The chart shows the 50 week moving average and below, the percentage that price is above or below that moving average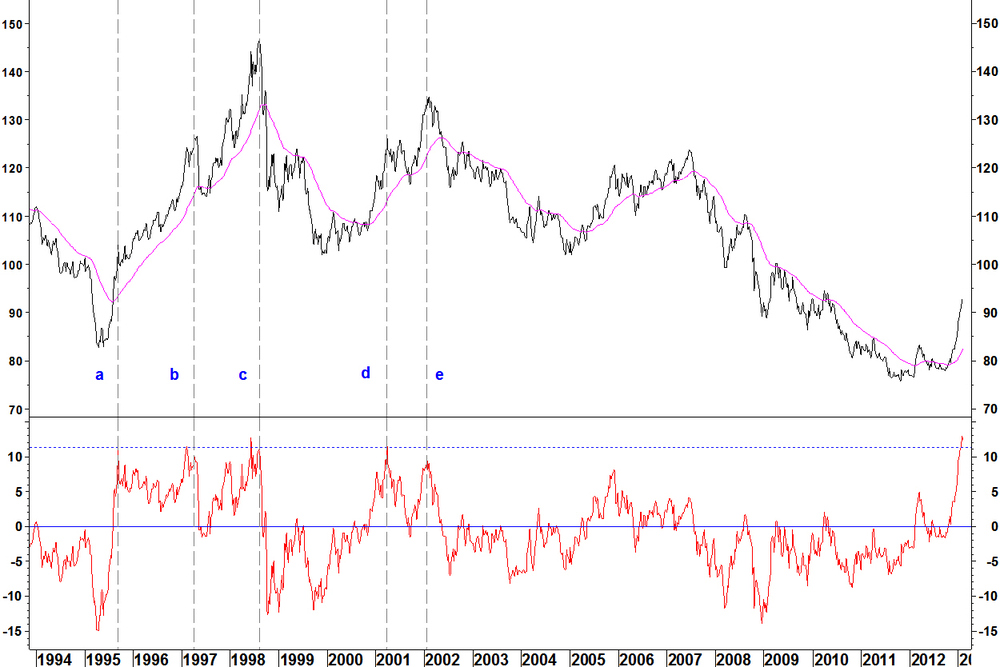
- The distance from the moving average has peaked at around 11.3% five times since 1995
- On two occasions (b and c), the peak in the currency chart came slightly after the peak in the percentage chart
- In 1995, a time ‘a’, the pullback in the currency chart was quite shallow, although it lasted three months. Pullbacks can be quite shallow when a strong new trend is developing
- There is a chance that the same thing will occur now
04 February
Limited Brands (LTD) is a retailer of women’s underwear (Victoria’s Secret and so on). Using my Metastock scans for stocks fitting my moving average crossover method, I found that this stock is particularly vulnerable on a price and relative basis. Limited Brands (price chart)
- The 12 week moving average crossed above the 26 week average in May 2009 and there has been no crossover since then
- The MACD has shown a divergence since the April 2012 high and a moving average crossover appears imminent
- There was also a divergence in November 2011 (blue arrow) but this was eventually blown away. This can happen with divergences, which is why I look ideally for moving averages that have not crossed for four years as they are better candidates. We are three months short of four years here
- The divergence is not the signal, instead the moving average crossover is, which is yet to occur
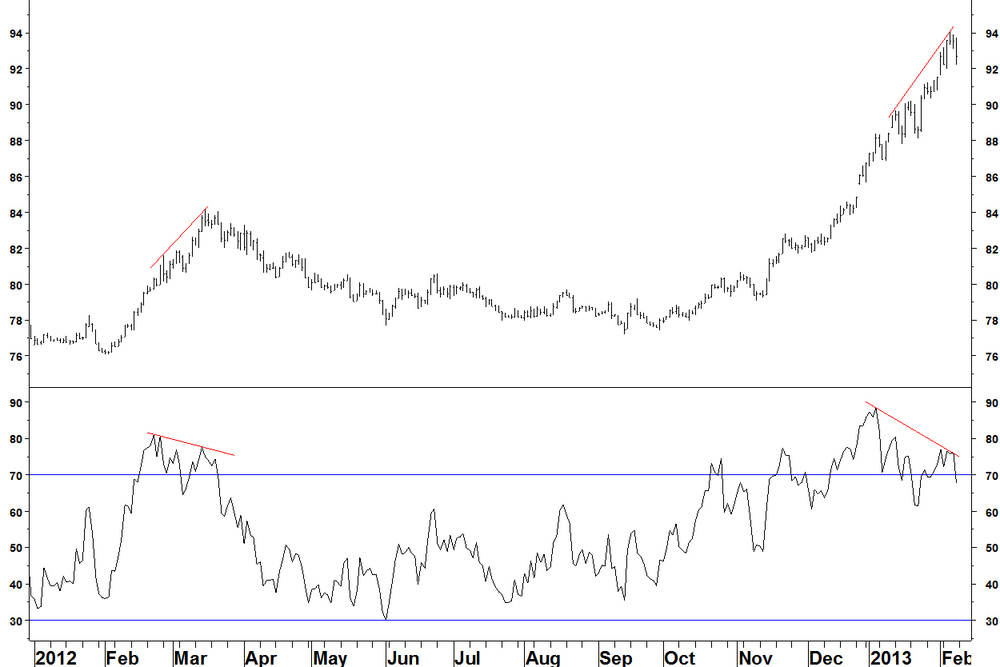
LTD v S&P500 Index
- The 12 week moving average crossed above the 26 week average in April 2009 and there has been no crossover since then
- The MACD had divergence during 2012 but there was one last high in November 2012 before the moving averages crossed in early January
- A long term crossover signal has been given on a moving average pair that hadn’t crossed for almost four years
This signals a change from outperformance to underperformance for LTD in the long term. Remember, as discussed with other moving average crossover examples recently, this is not a precise timing signal. The ratio could easily rally back to the moving averages over the next few months. In six to nine months though, I expect this ratio to be lower.
SPDR Financial (XLF) v LTD
- The moving averages last crossed in early January 2009
- A base formed between September 2011 and December 2012
- The moving averages crossed in late 2012 and the ratio has broken above the base
- Again, this may consolidate for months but this ratio should move higher in the medium term
More precise trading signals are given by my Bollinger Band method and my RSI divergence method. I scanned for pairs including LTD that fitted these criteria but there was nothing convincing. When a stock fits one pattern, it is less likely to fit another pattern.
28 January
On 10 December, I showed that breadth for the components of the Philadelphia Gold & Silver Index (XAU) was oversold on a short term breadth indicator (% of stocks above their 50 day moving average). I also showed that the longer term breadth indicator, the % above their 200 day moving average was not oversold. Here is an update. XAU and percentage of stocks above their 200 day moving average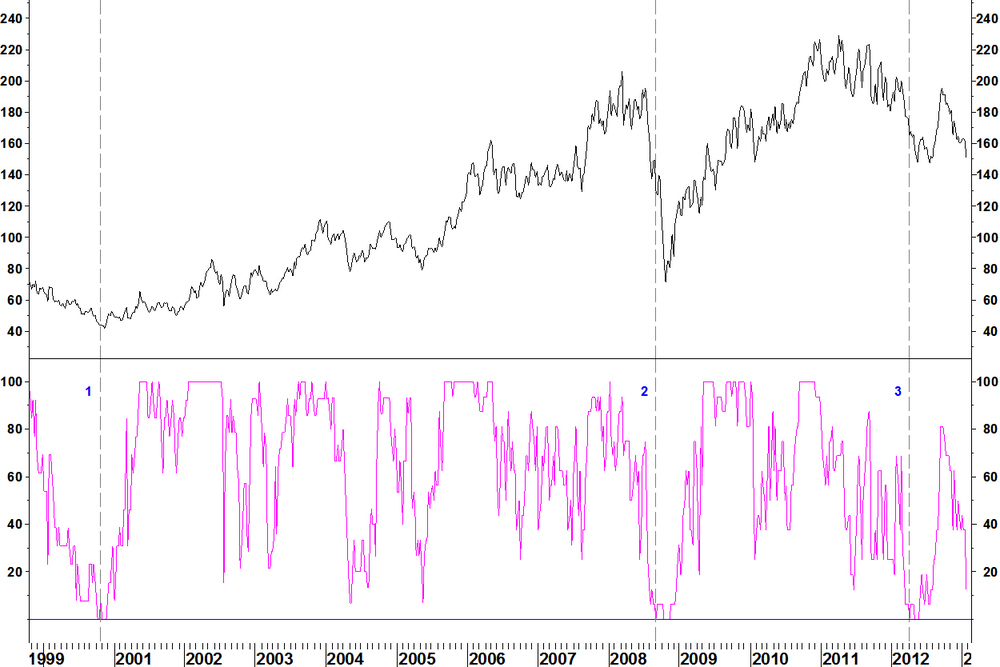
- The percentage of stocks above their 200 day moving average has fallen from 37.5% to 12.5% (2 of the 16 components)
- Long term breadth is not yet oversold
- If breadth gets oversold, combining this with another of my methods, like a bullish weekly RSI divergence would be a high probability entry point. This idea was shown with Pan American Silver (PAAS) in the 10 December article
The issue with patterns: Daily chart of XAU

Over December and much of January, XAU traded sideways. Some analysts would suggest that a base was forming. The trouble was that the base was not forming under ideal conditions, such as:
- Weekly RSI oversold with bullish divergence
- Daily RSI divergences but now above 30
- Long term breadth oversold, possibly with bullish divergence
The potential base became a consolidation in a downtrend. This tells me that patterns alone are not worth analysing. They are what is traced out, they do not make anything happen on their own. You can use breaks of pattern formations as entry mechanisms only when other factors (those outlined in my methods) are ideally lined up.
28 January
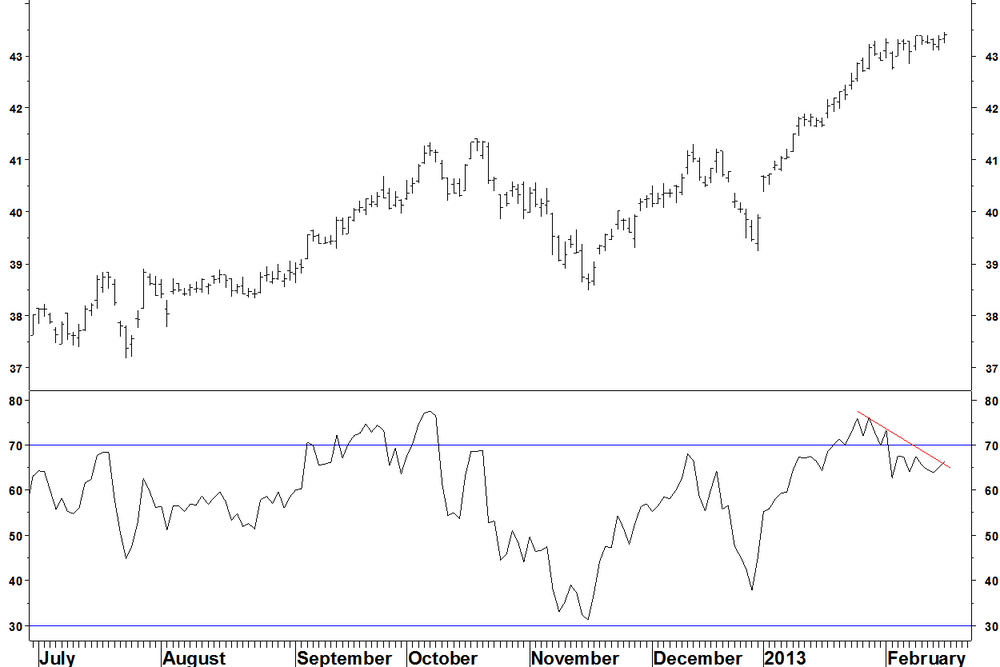
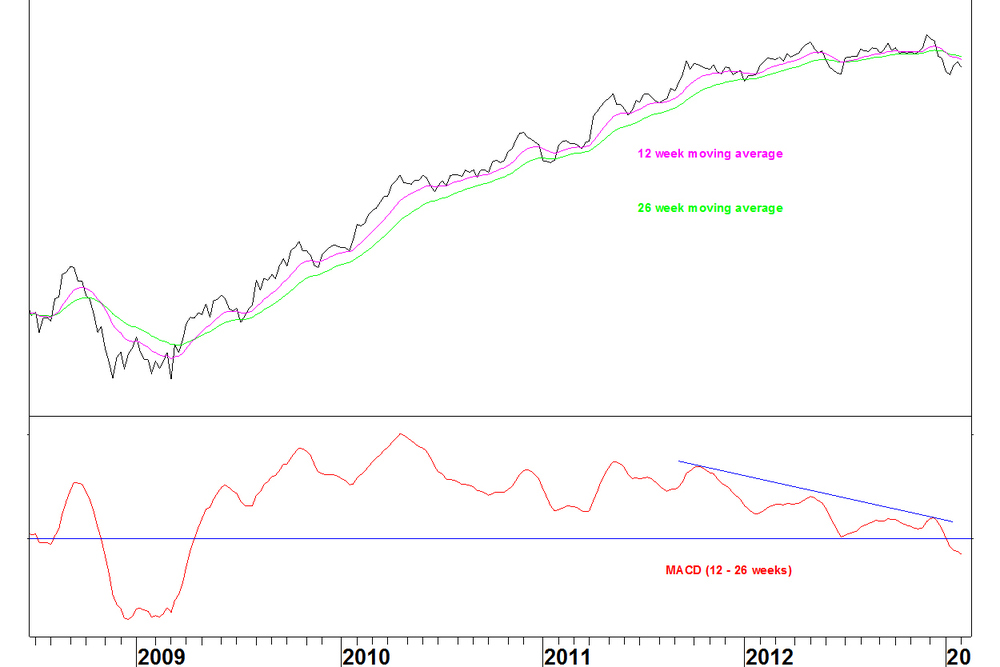
InterActiveCorp (ticker: IACI), was shown on 03 December and again on 13 January, as an example of a stock that fitted my moving average crossover method.
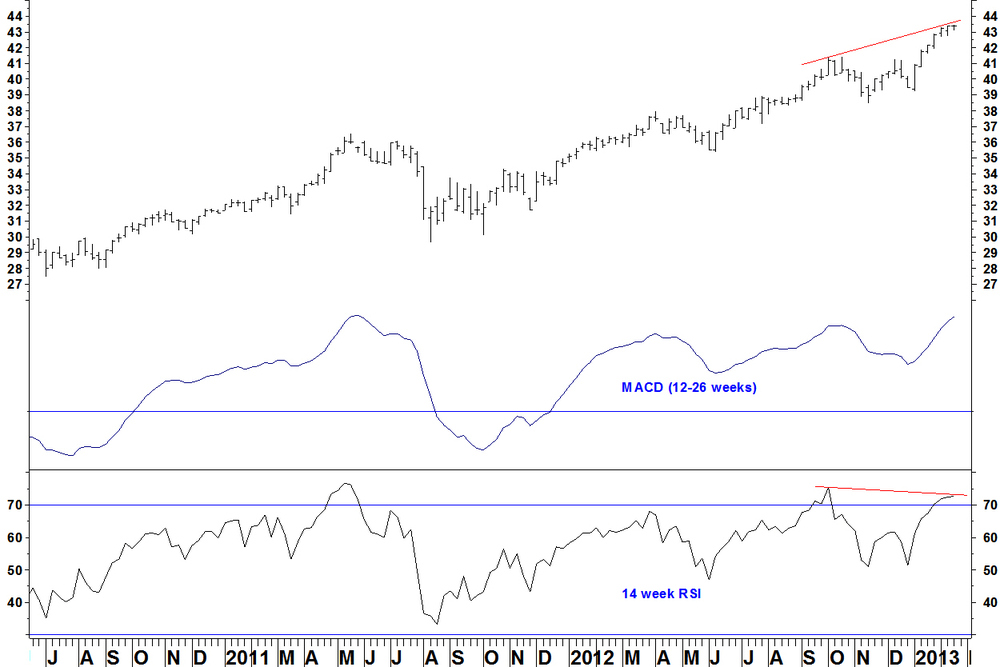
The pair of the Dow Jones Food Index v IACI has now gained 24.8% since 03 December and 26.6% since 31 December, when it started rallying. I do not record trades in my trading ledger for these examples as I do for my Bollinger Band and RSI divergence trades. The reason is that they don’t have a defined entry method like the other two. This pair spent the first half of the time since 03 December going sideways and there was no clear way of telling when the trend change would progress. Dow Jones Food Index vs. IACI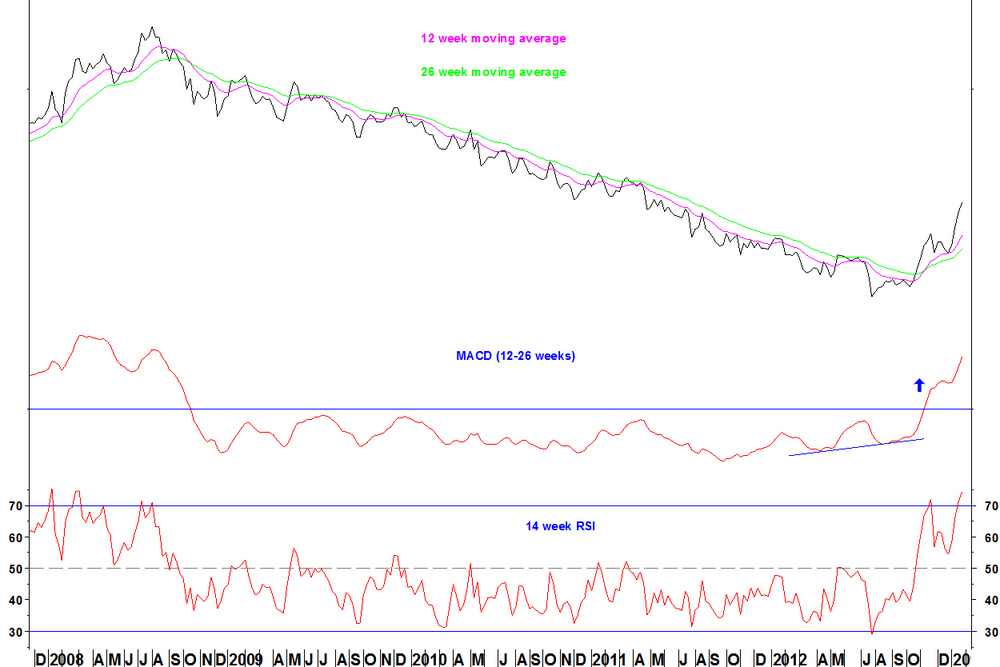
The 14 week RSI is overbought at 74. In late November, this RSI peaked at 72 and the pair consolidated for five weeks.
Daily chart
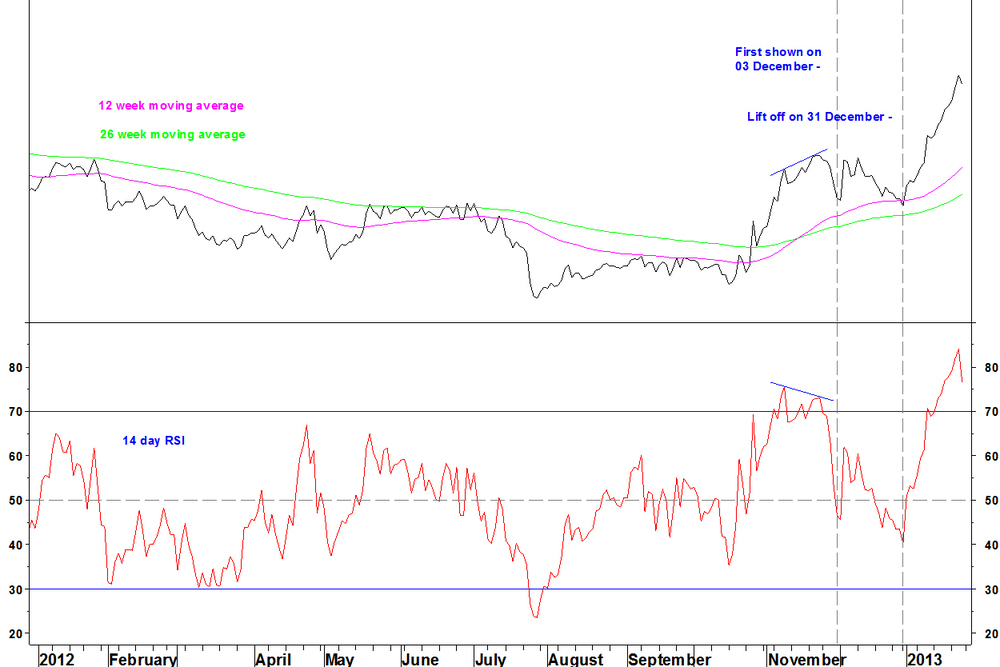
- The 14 day RSI is overbought at 76
- The ratio last peaked on 23 November (with a bearish RSI divergence) at 14.1% above its 12 week moving average
- The ratio is now 17.5% above its 12 week moving average
Conclusion
- The ratio is overbought in the short term and will likely pull back towards the moving averages in the coming weeks
- There are no RSI and MACD divergences on the weekly chart, so after a period of consolidation, the trend might continue
- There is no guarantee that just because a long term moving average cross over has happened that this trend will continue
20 January
The position in the SPDR Financial (XLF) v SPDR Energy (XLE) has been closed. The stop loss was moved to break even on 13 January and was hit on Friday 18 January. The ratio moved back within the upper Bollinger Band. Thinking about why this breakout did not hold, whilst other breakouts do hold (such as the Japanese stock pair I’ve showed recently), the difference is the lack of an external factor, such as Yen weakness to drive it. This does not make the volatility contraction a complete red herring, as I have observed many strong medium term moves starting from a volatility contraction. Instead, it shows that the best volatility contractions will have another factor supporting the case, preferably fitting another of my methods. The USD v JPY chart was an example of my long term moving average crossover method. This can be a focus of my search going forward. Practically, moving the stop loss to break even as soon as possible and/or stopping the trade on a move back within the upper Bollinger Band provide a quick way of telling which trades will work that keeps losses on these trades small.