Gold stocks still not oversold on breadth
28 January
On 10 December, I showed that breadth for the components of the Philadelphia Gold & Silver Index (XAU) was oversold on a short term breadth indicator (% of stocks above their 50 day moving average). I also showed that the longer term breadth indicator, the % above their 200 day moving average was not oversold. Here is an update. XAU and percentage of stocks above their 200 day moving average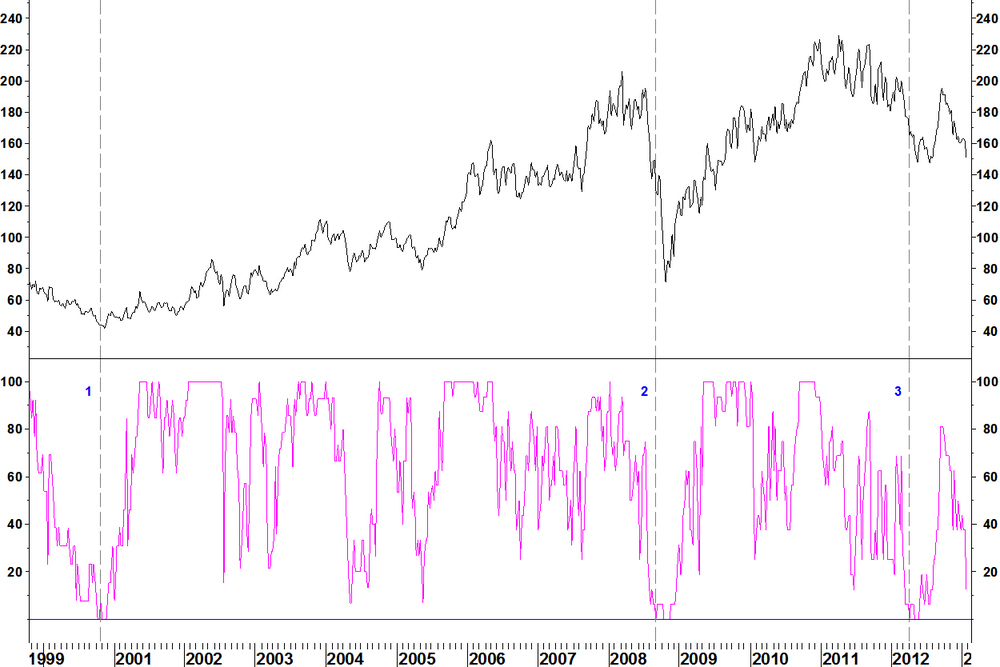
- The percentage of stocks above their 200 day moving average has fallen from 37.5% to 12.5% (2 of the 16 components)
- Long term breadth is not yet oversold
- If breadth gets oversold, combining this with another of my methods, like a bullish weekly RSI divergence would be a high probability entry point. This idea was shown with Pan American Silver (PAAS) in the 10 December article
The issue with patterns: Daily chart of XAU

Over December and much of January, XAU traded sideways. Some analysts would suggest that a base was forming. The trouble was that the base was not forming under ideal conditions, such as:
- Weekly RSI oversold with bullish divergence
- Daily RSI divergences but now above 30
- Long term breadth oversold, possibly with bullish divergence
The potential base became a consolidation in a downtrend. This tells me that patterns alone are not worth analysing. They are what is traced out, they do not make anything happen on their own. You can use breaks of pattern formations as entry mechanisms only when other factors (those outlined in my methods) are ideally lined up.
Leave a Comment
