InterActiveCorp: Long term moving average crossover leads to a 25% move
28 January
InterActiveCorp (ticker: IACI), was shown on 03 December and again on 13 January, as an example of a stock that fitted my moving average crossover method.
The pair of the Dow Jones Food Index v IACI has now gained 24.8% since 03 December and 26.6% since 31 December, when it started rallying. I do not record trades in my trading ledger for these examples as I do for my Bollinger Band and RSI divergence trades. The reason is that they don’t have a defined entry method like the other two. This pair spent the first half of the time since 03 December going sideways and there was no clear way of telling when the trend change would progress. Dow Jones Food Index vs. IACI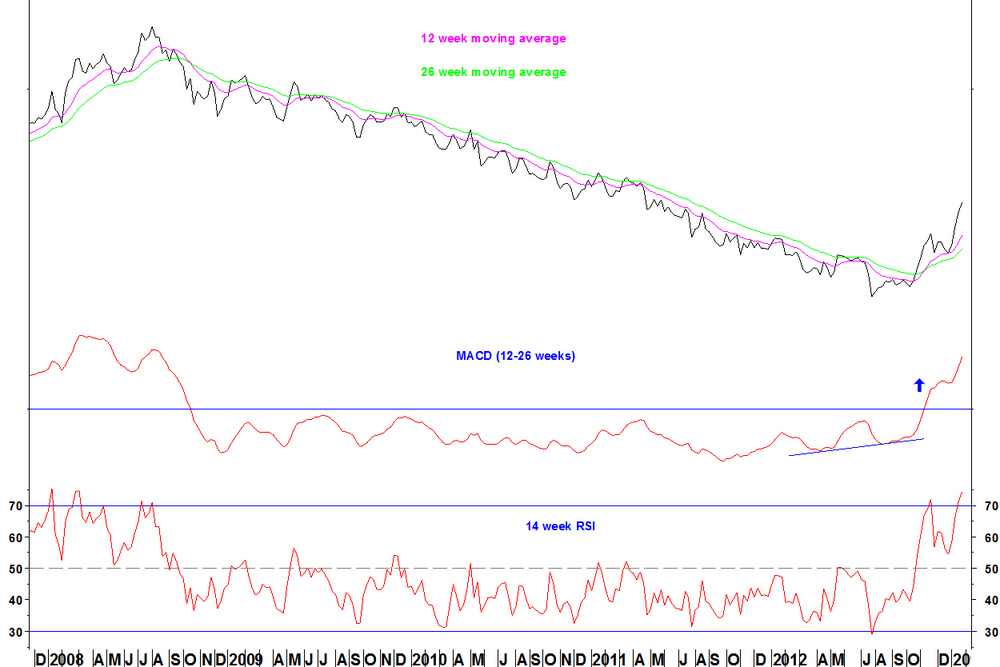
The 14 week RSI is overbought at 74. In late November, this RSI peaked at 72 and the pair consolidated for five weeks.
Daily chart
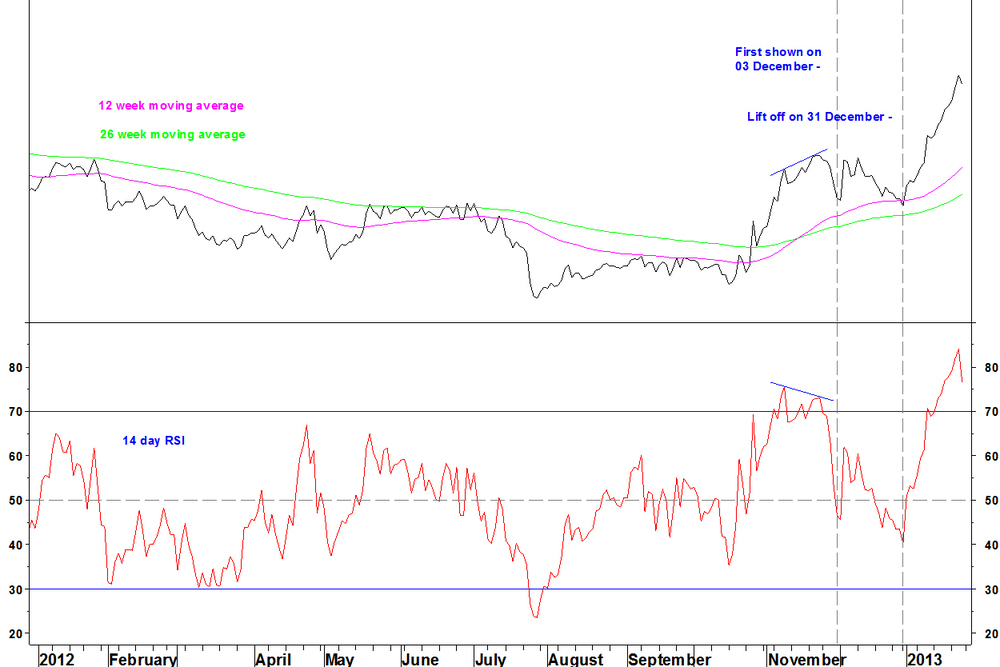
- The 14 day RSI is overbought at 76
- The ratio last peaked on 23 November (with a bearish RSI divergence) at 14.1% above its 12 week moving average
- The ratio is now 17.5% above its 12 week moving average
Conclusion
- The ratio is overbought in the short term and will likely pull back towards the moving averages in the coming weeks
- There are no RSI and MACD divergences on the weekly chart, so after a period of consolidation, the trend might continue
- There is no guarantee that just because a long term moving average cross over has happened that this trend will continue
Leave a Comment
