Japan: Stock index and currency charts show daily divergences
10 February
My RSI divergence criteria require a weekly divergence for a trade to be justified, which is not the case here. However, it is worth noting these daily RSI divergences. Topix Index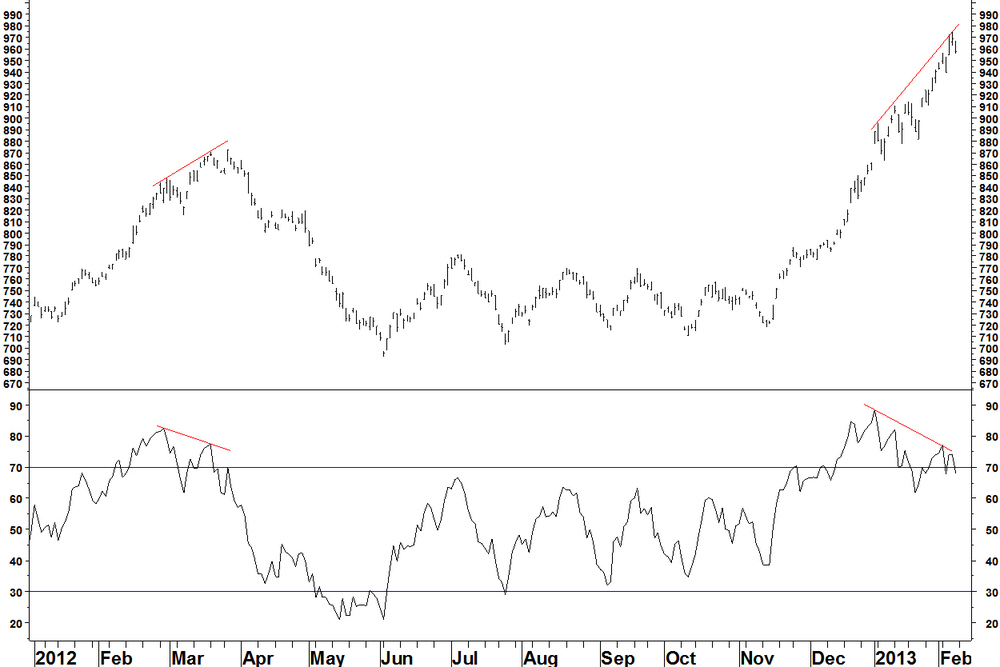
- A daily RSI divergence has formed, as was the case in March 2012
- The March 2012 divergence led to a two month decline of 20%
- There was also a daily divergence in February 2011 (just before the earthquake – spooky!)
- There were also daily divergences in January 2010 and April 2010, leading to a one month pullback and the high for the index since the 2009 low
US Dollar v Yen
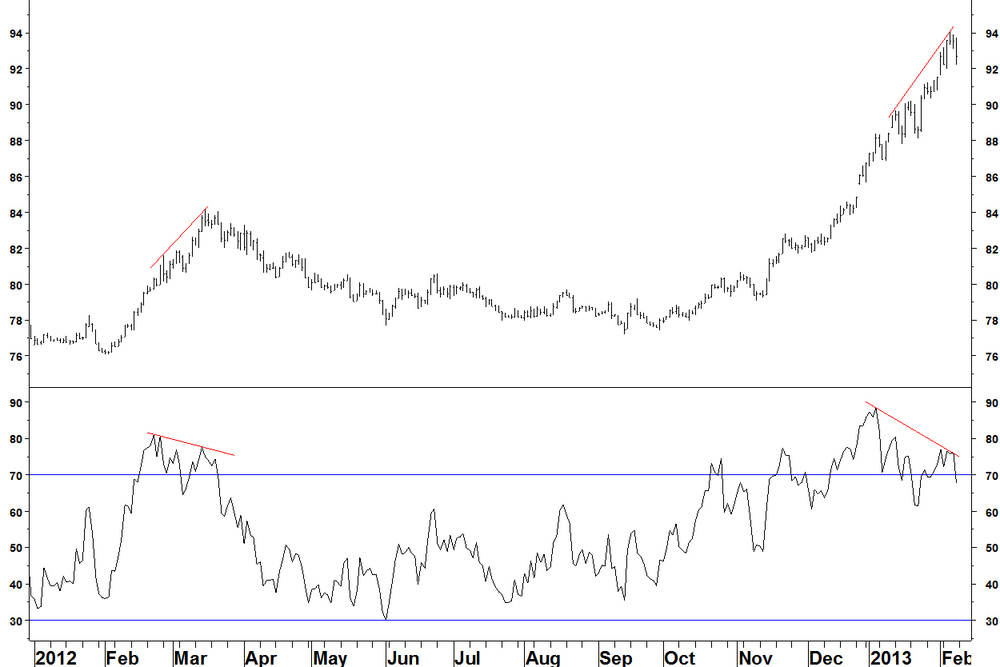
- A daily RSI divergence has formed, as was the case in March 2012
- In March 2012, the end of the rallies in the Topix and the in USD v JPY were quite close
- The fortunes of the Yen have a significant impact on the Topix. With both showing daily RSI divergences, it is time to take profit if you’ve been in these trades
US Dollar v Yen and 50 week moving average
The chart shows the 50 week moving average and below, the percentage that price is above or below that moving average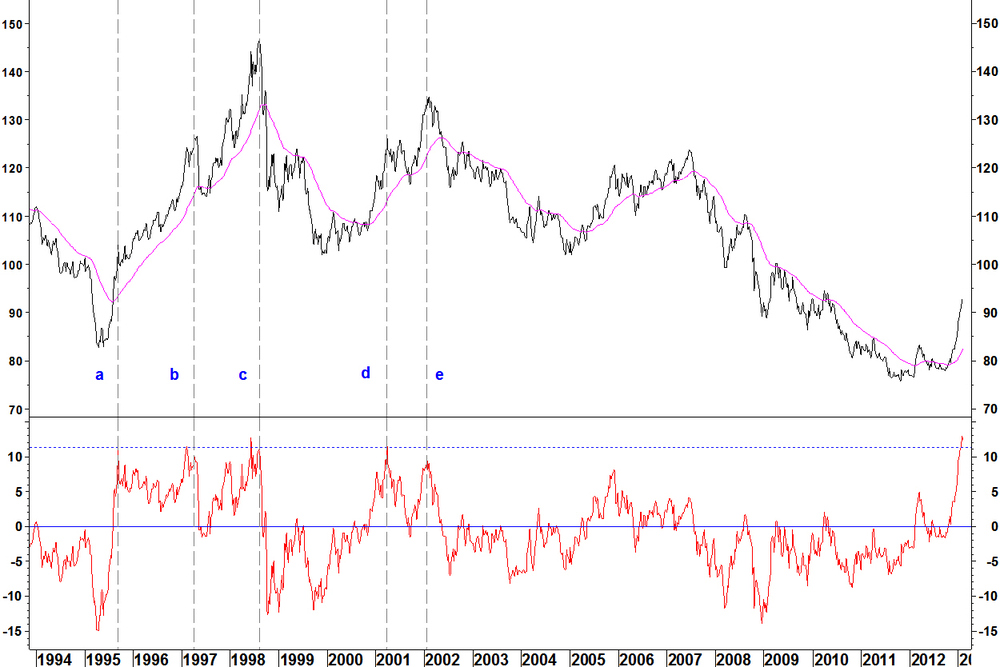
- The distance from the moving average has peaked at around 11.3% five times since 1995
- On two occasions (b and c), the peak in the currency chart came slightly after the peak in the percentage chart
- In 1995, a time ‘a’, the pullback in the currency chart was quite shallow, although it lasted three months. Pullbacks can be quite shallow when a strong new trend is developing
- There is a chance that the same thing will occur now
Leave a Comment
