Limited Brands: never mind the product, look at the chart
04 February
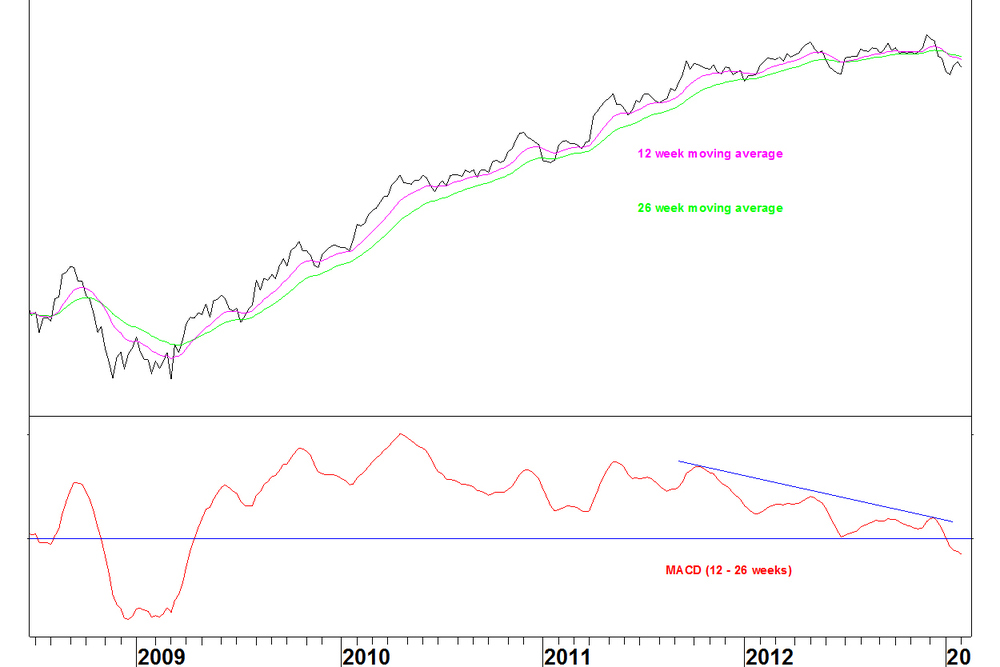
Limited Brands (LTD) is a retailer of women’s underwear (Victoria’s Secret and so on). Using my Metastock scans for stocks fitting my moving average crossover method, I found that this stock is particularly vulnerable on a price and relative basis. Limited Brands (price chart)
- The 12 week moving average crossed above the 26 week average in May 2009 and there has been no crossover since then
- The MACD has shown a divergence since the April 2012 high and a moving average crossover appears imminent
- There was also a divergence in November 2011 (blue arrow) but this was eventually blown away. This can happen with divergences, which is why I look ideally for moving averages that have not crossed for four years as they are better candidates. We are three months short of four years here
- The divergence is not the signal, instead the moving average crossover is, which is yet to occur
LTD v S&P500 Index
- The 12 week moving average crossed above the 26 week average in April 2009 and there has been no crossover since then
- The MACD had divergence during 2012 but there was one last high in November 2012 before the moving averages crossed in early January
- A long term crossover signal has been given on a moving average pair that hadn’t crossed for almost four years
This signals a change from outperformance to underperformance for LTD in the long term. Remember, as discussed with other moving average crossover examples recently, this is not a precise timing signal. The ratio could easily rally back to the moving averages over the next few months. In six to nine months though, I expect this ratio to be lower.
SPDR Financial (XLF) v LTD
- The moving averages last crossed in early January 2009
- A base formed between September 2011 and December 2012
- The moving averages crossed in late 2012 and the ratio has broken above the base
- Again, this may consolidate for months but this ratio should move higher in the medium term
More precise trading signals are given by my Bollinger Band method and my RSI divergence method. I scanned for pairs including LTD that fitted these criteria but there was nothing convincing. When a stock fits one pattern, it is less likely to fit another pattern.
Leave a Comment
