Health sector has RSI and breadth divergence
18 February
Divergences between price and an indicator often mark extremes. I look for weekly RSI divergences and separately, for breadth divergences. When these coincide, that strengthens the case for a reversal. SPDR Health (XLV): Breadth divergence XLV and %age of component stocks above their 100 day average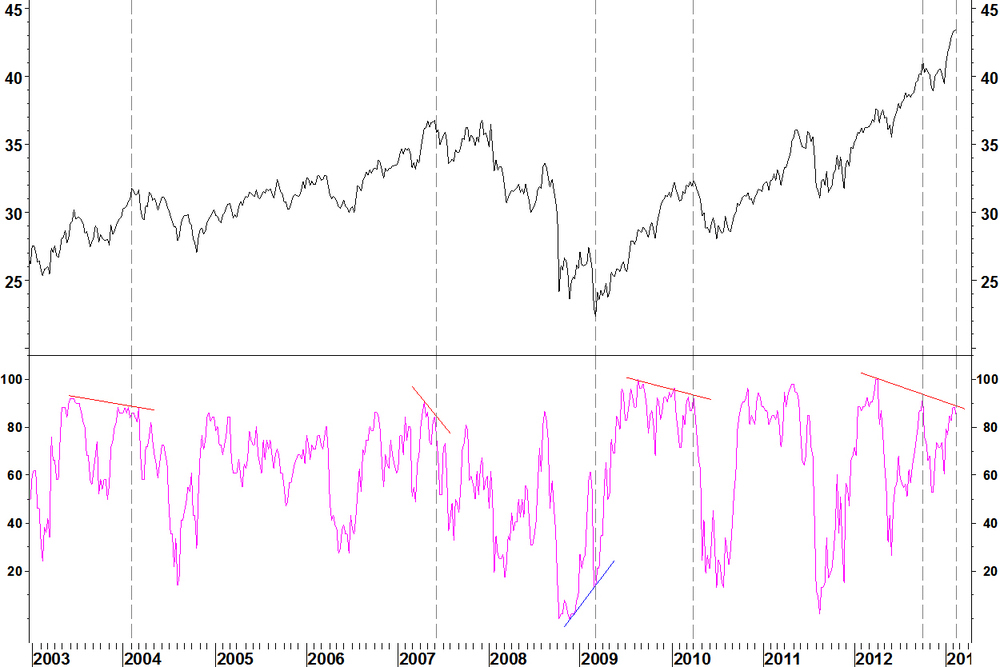
There is a decent record of breadth divergences marking extremes over the last 10 years.
- A lower breadth high formed at the February 2004 high, leading to a price low in October 2004
- A lower breadth high formed in June 2007. There was a retest in December 2007 (price fractionally lower, breadth much lower)
- A higher breadth low formed in March 2009 at the low
- Breadth divergence formed in January 2010 at the high. The April 2010 retest had lower breadth still
Now..
- Breadth peaked in April 2012. A price high formed in October 2012 on a divergence
- The latest price high has breadth divergence against the October high
SPDR Health (XLV): RSI divergence
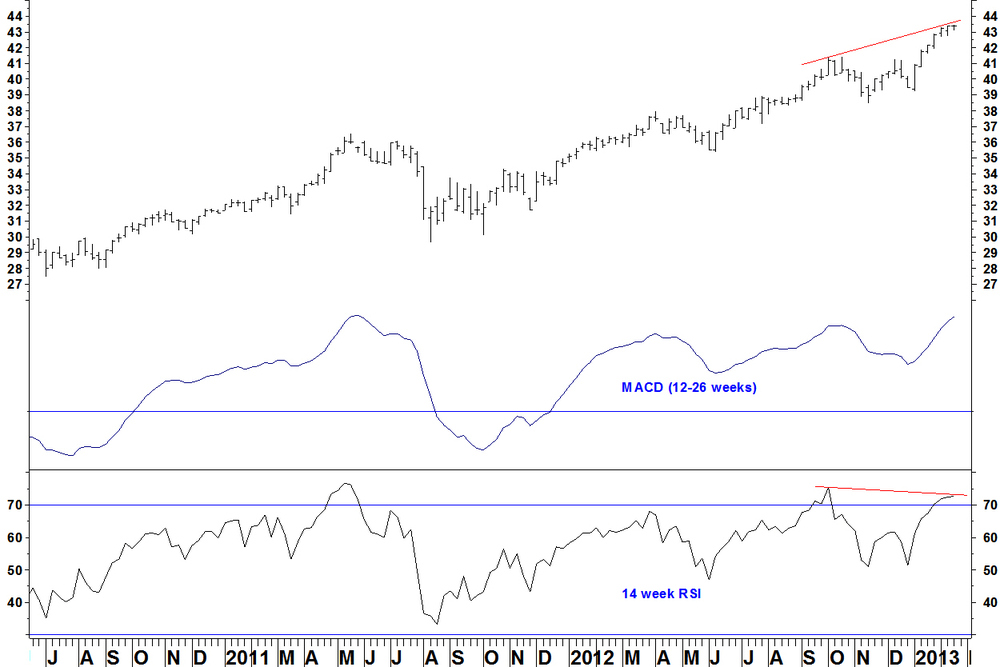
- XLV has a weekly RSI divergence
- There is no MACD divergence, which would be ideal
Daily chart
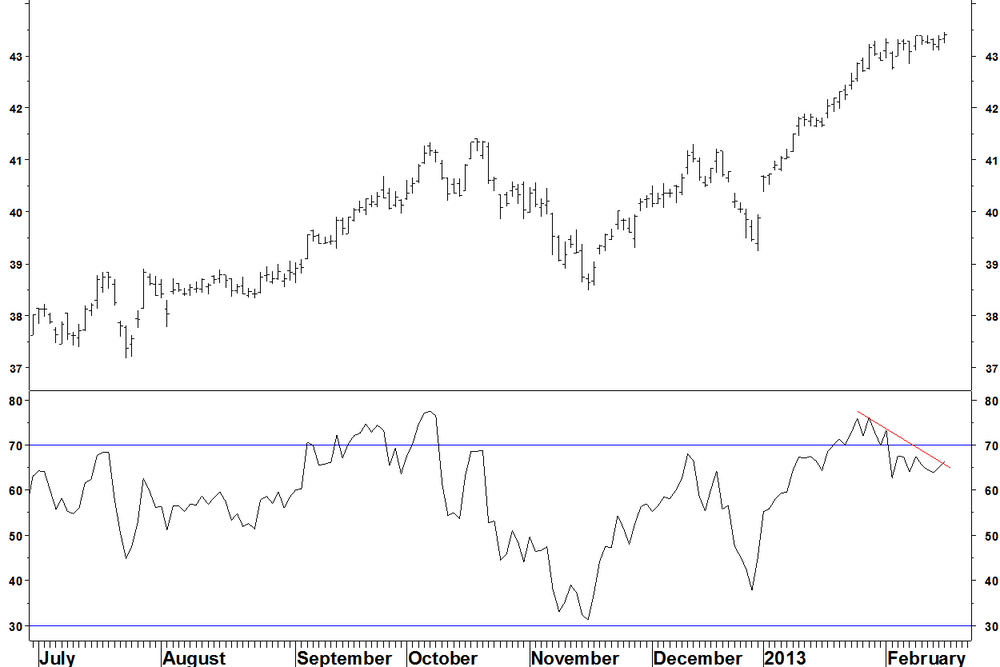
- The first divergence (above 70) came on 01 February, which failed to hold the advance
- Another divergence has formed (below 70 this time), meeting my RSI divergence criteria
Entry criteria
The entry signal is a weekly RSI close below the intervening low but at times, a weekly reversal bar can be taken. Now is a time to make that exception. With the intervening RSI low at 51 from mid November, a large move is required, spoiling the risk:reward of the trade. A weekly reversal bar is a Friday close below last week’s low of $43.09. Then, a short position will be taken with a stop loss above the high ($43.45). Mining sector recap In October, I showed a hindsight example of the above using the mining sector. SPDR Metals & Mining (XME)
- The price low from the July breadth divergence has held for now but the rally has been modest
- The breadth indicator has unwound from oversold
- Many components have crossed their falling 200 day moving average through the passing of time, just like XME
Leave a Comment
