I am closing the long Wal-Mart (WMT) short NASDAQ 100 Trust (QQQ) trade now. I did so in real life a few hours ago and should have posted it then but for this, I’ll have to take the live prices, they are: WMT: $75.07 and QQQ: $92.63.
I had a 6% gain in real life but it will be less in this model portfolio, a shame for a well executed trade that followed my RSI divergence set up.
The trade had not been profitable today even at the lows and was always going to underperform on a rebound, so it made sense to close it.
The entry criteria that I set out last week for the long Wal-Mart short NASDAQ 100 trade were met last Thursday.
Wal-Mart (WMT) v NASDAQ 100 Trust (QQQ): Daily chart
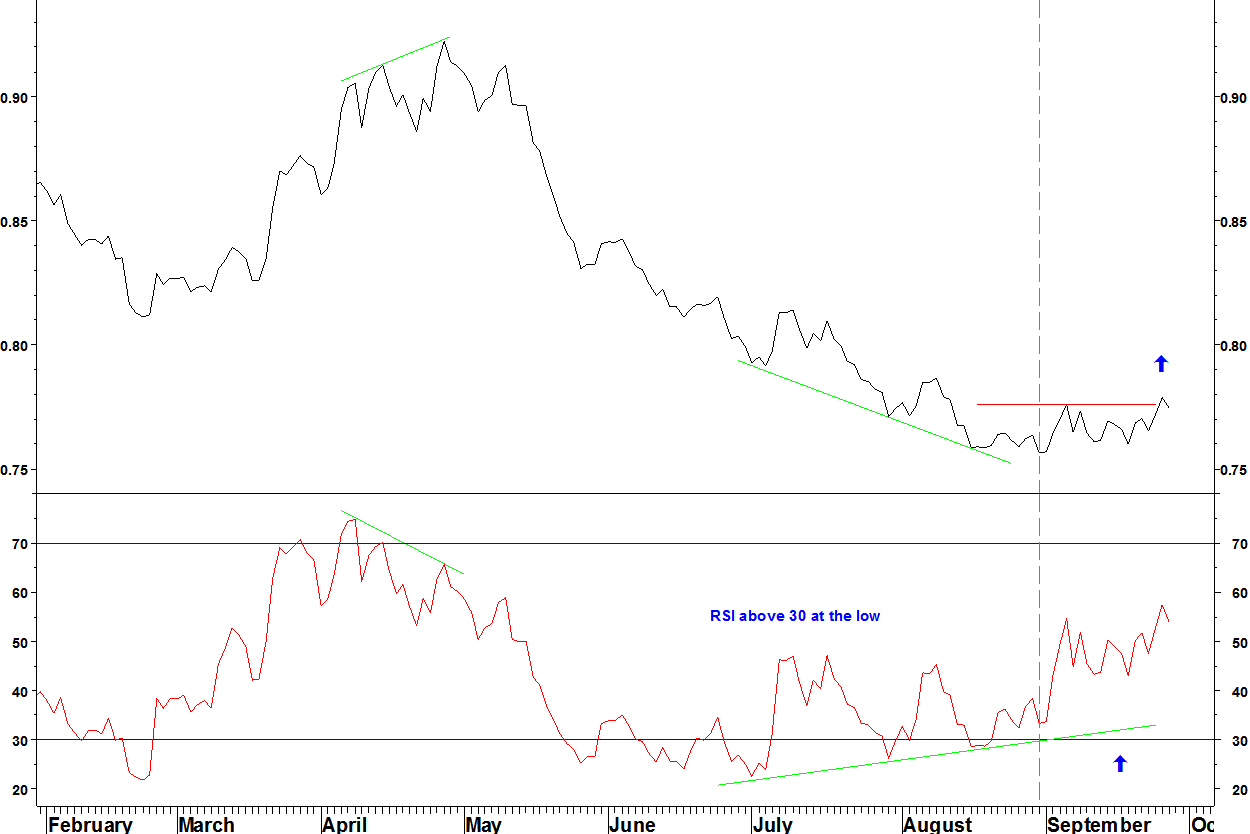
- The low of 29 August (dashed line) was a bullish RSI divergence above 30 after divergences below 30 had been formed. This matches the RSI divergence criteria
- The 05 September high of 0.77595 (red line) was broken on Thursday with a close at 0.7788.
- The trade is entered at this level with a stop loss as a close below the 29 August low (2.8% lower)
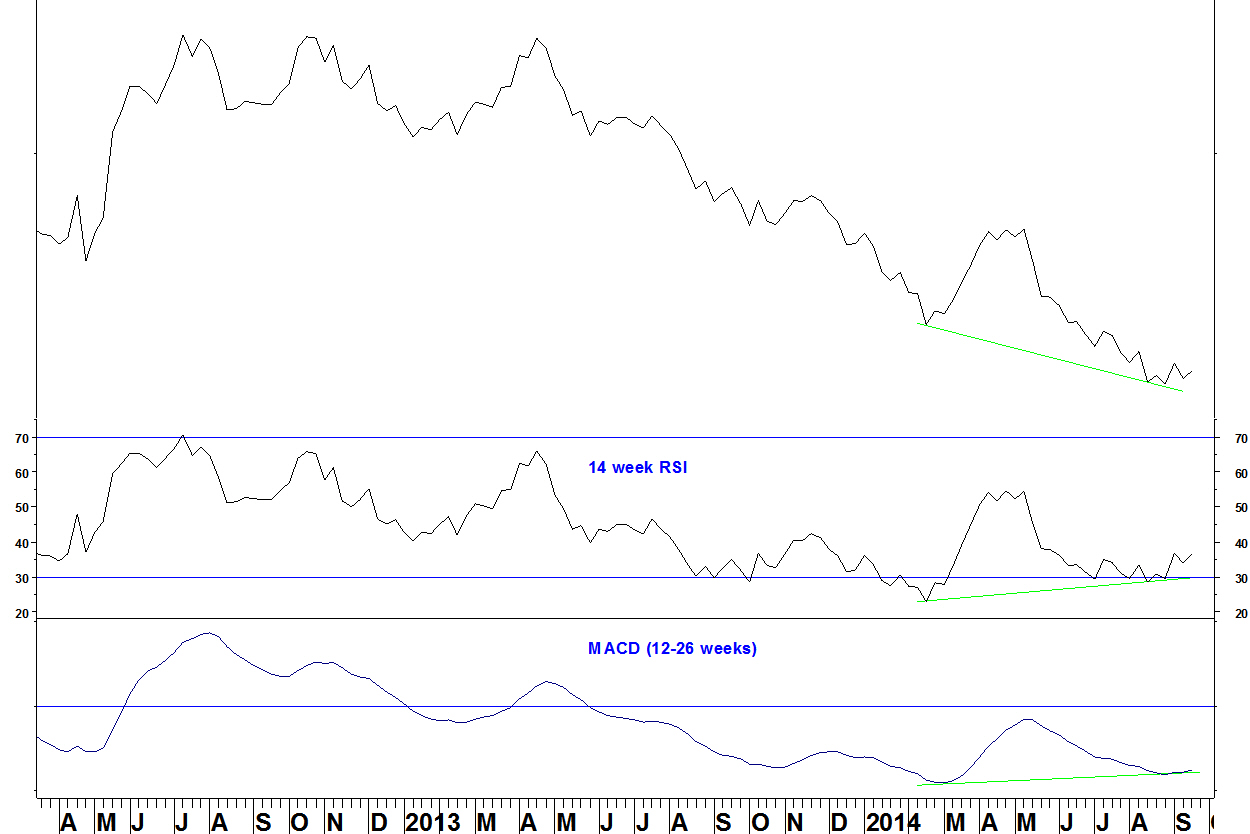
Wal-Mart (WMT) v SPDR Consumer Staples (XLP)
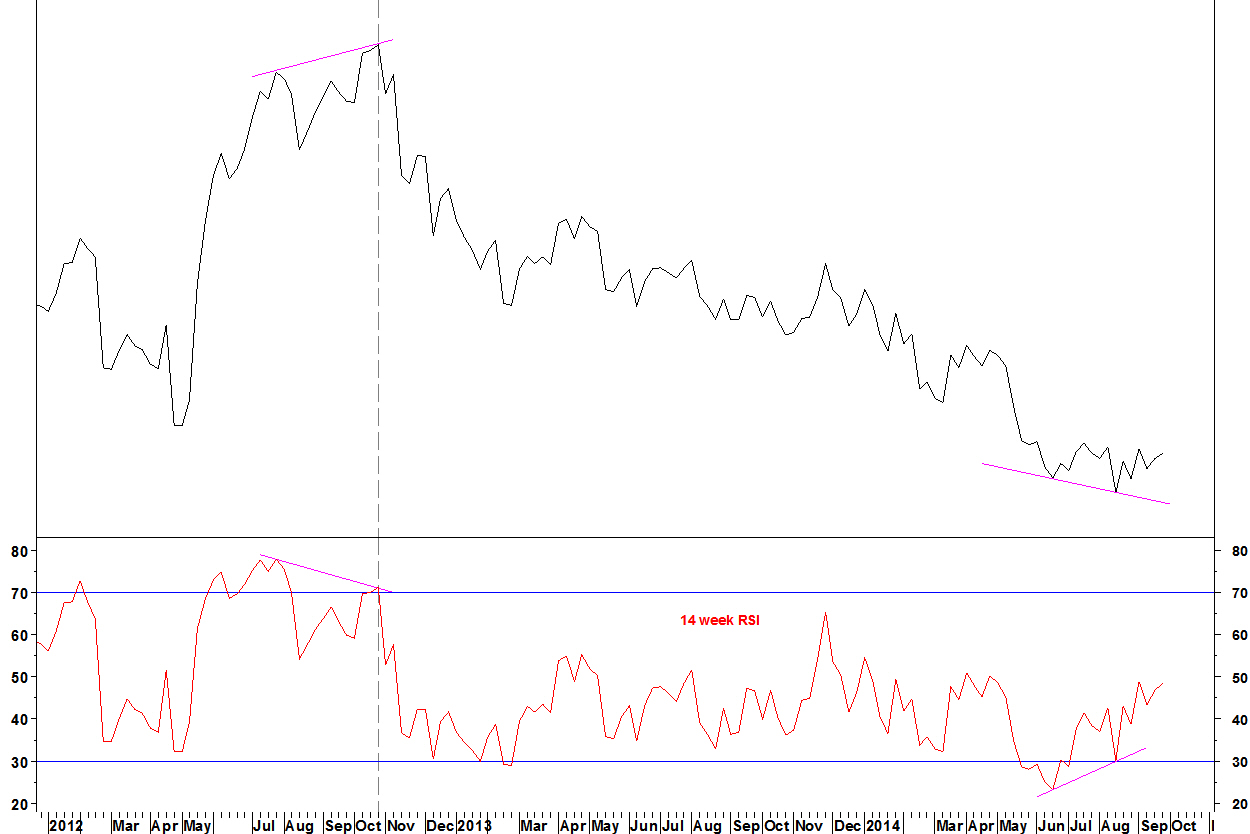
- The October 2012 relative high was formed with bearish divergence on the 14 week RSI.
- For the first time in this relative downtrend, there is bullish RSI divergence (at the August relative low – RSI was fractionally above 30 at the low)
- This should help WMT be a good pick from the consumer staples sector
In March, I closed a short position in the S&P Restaurants Index versus the S&P 500 Index, following a bullish daily RSI divergence.
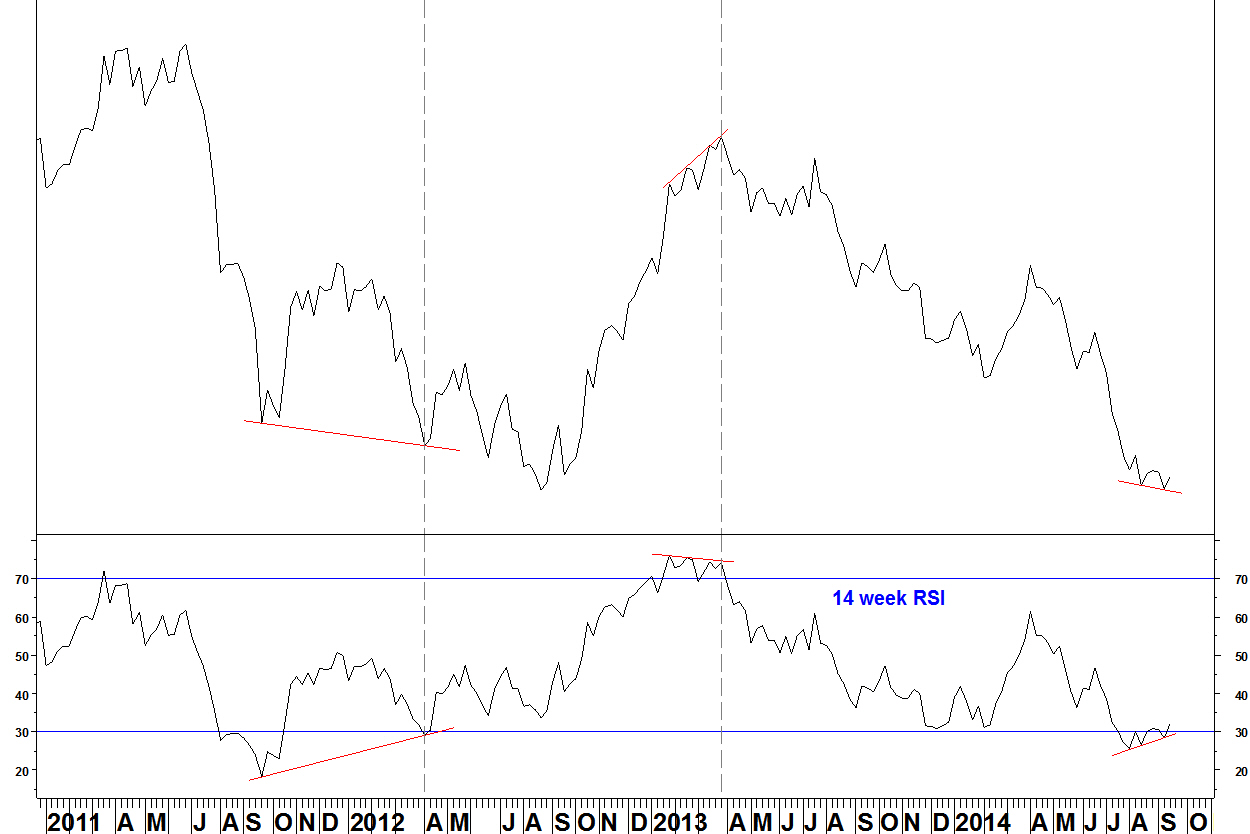
S&P Restaurants Index versus S&P 500 Index

- The divergence unwound for four months, then the long term sector rotation continued – the underperformance resumed
- Another bullish RSI divergence was formed on 18 September, marking a low
Weekly chart
- The daily RSI divergence coincided with the weekly RSI being oversold
- There is no MACD divergence, so no specific reason to think that the underperformance is over
Last week, I showed how the NASDAQ 100 Index was in position to underperform other indices, which had bullish RSI divergence against the NASDAQ. I can then scan for long side candidates for this pair which match my RSI divergence criteria. Wal-Mart (WMT) meets these criteria exactly.
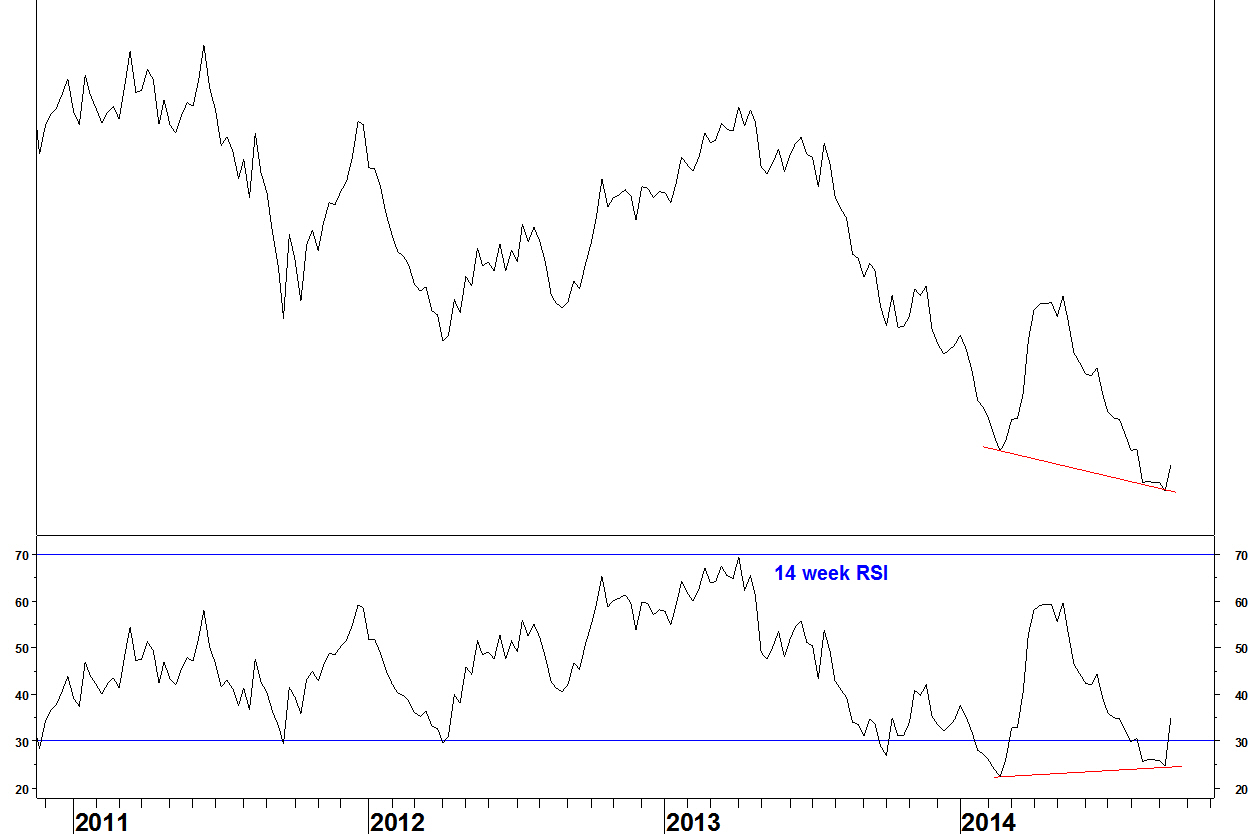
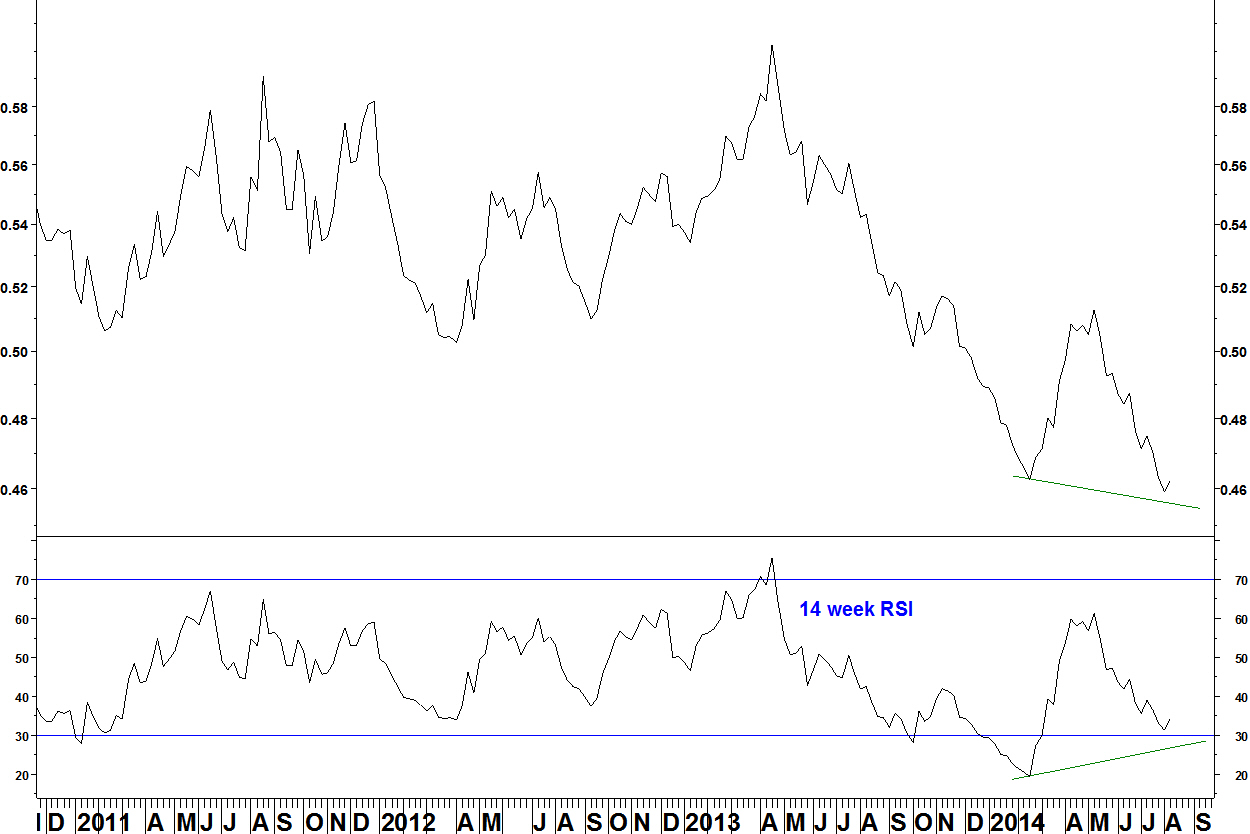
Wal-Mart (WMT) v NASDAQ 100 Trust (QQQ)
- The pair has been in a downtrend since April 2013 and has lost 33.2%
- There is bullish divergence against the February low on the 14 week RSI and the MACD
- There was bullish divergence within this low, against the 15 August low
Daily chart

- The low of 29 August (dashed line) was a bullish RSI divergence above 30 after divergences below 30 had been formed. This matches the RSI divergence criteria
- A similar divergence had formed at the late April high
- A break above the 05 September high of 0.77595 (red line) will complete the short term trend change
- A daily close above 0.77595 will be used as an entry signal. The stop loss will be a close below the 29 August low (2.5% lower)
Summary
- Buy the pair WMT versus QQQ on a daily close above 0.77595, with a stop loss as an end of day close below the low of 0.75666
- Earnings for WMT are not until mid November, I try to avoid trading stocks with upcoming earnings and there is plenty of time before this
There is bearish breadth divergence for the components of the NASDAQ 100 Index. I have breadth data for the major US indices, based on the percentage of stocks above differing period moving averages. This is sourced from Pinnacle Data and was introduced on 07 May 2012.
NASDAQ 100 Index and %age of stocks above their 50 day moving average

- The new high comes with fewer stocks above their 50 day moving average than in July
- There were bearish divergences at the peaks in April 2012, September 2012 and March 2014. Not all came on the first divergence, so be aware that divergence can persist before a peak
- Price lows since October 2011 have come with breadth at around 20%, it currently stands at 54%
- The same chart for the S&P 500 Index components shows the same current feature. This breadth divergence is a broader market characteristic
NASDAQ 100 Index relative to other market indices
Other indices have underperformed the NASDAQ 100 Index but now have bullish RSI divergences against the NASDAQ 100 Index.
S&P 100 Index (large caps) vs NASDAQ 100 Index
- There is bullish divergence across the troughs for this ratio
- The ratio has broken a four month downtrend and the RSI has moved above 30
S&P 400 Index (mid caps) vs NASDAQ 100 Index
- There is bullish divergence within this trough against the August low. RSI has moved above 30
- This is a similar set up (in reverse) to the bearish divergence in early 2013
- There was bullish divergence across the troughs in April 2012, which prompted a seven week rally but was not a long term low
Summary
Market index breadth divergences suggest that at least a short term peak is here and ratio charts suggest that the NASDAQ 100 Index will underperform for at least the next few months
In early July, I showed the trade entry criteria for a short position in Vornado Realty Trust (VNO) against iShares U.S. Real Estate (IYR). The entry signal was given on 17 July and the trade has run into a small profit.
Vornado Realty Trust (VNO) v IYR
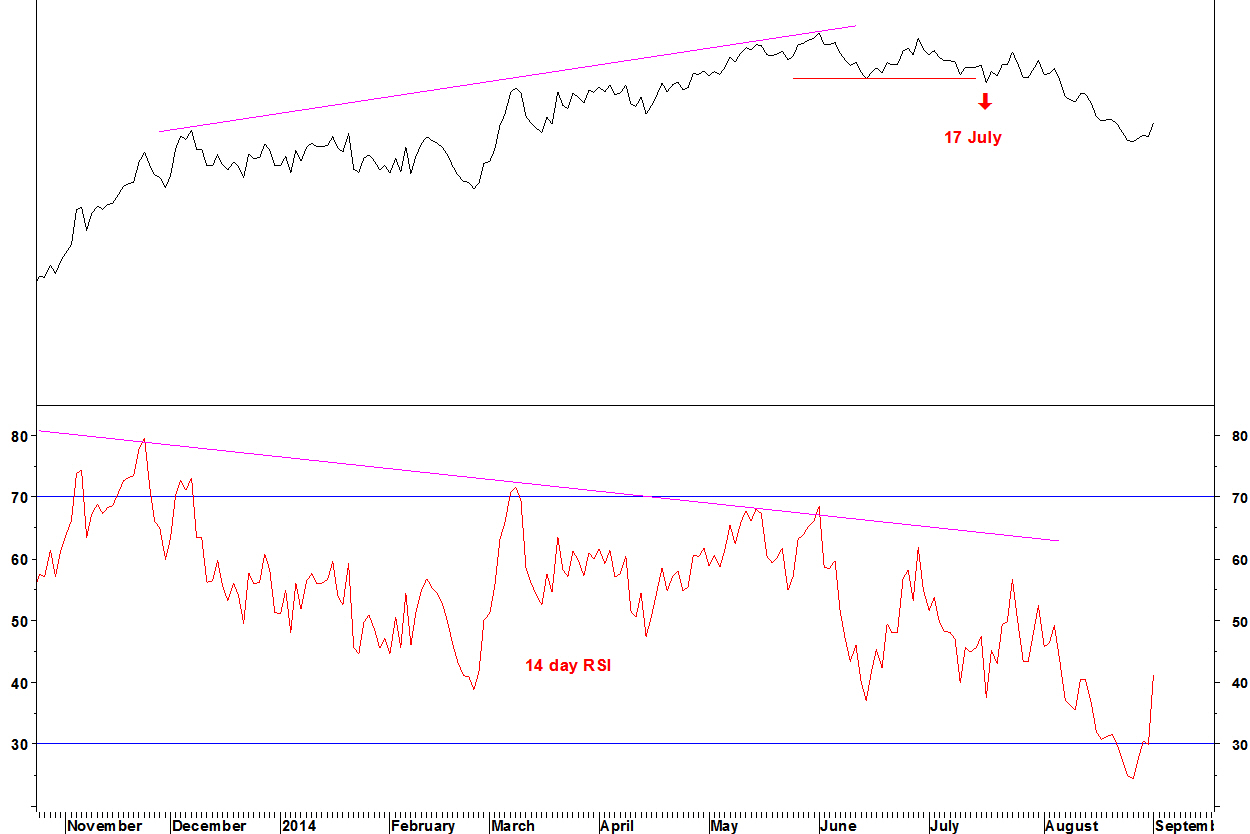
The initial entry signal was not timely but the longer term RSI and Performance Ranking divergences took effect and the pair declined up to 25 August. There has been a marginal recovery. Now, I take half of the profit (1.2% drop) and move the stop loss to break even
Update on Washington Real Estate (WRE)
I showed WRE v iShares Real Estate (IYR) on 09 June and updated the situation on 07 July. There has still not been a moving average crossover but there has been a break above the 09 June high.
WRE v IYR daily chart

The Performance Rank (PR) for WRE against the other components of the real estate sector ETF (IYR) is at its highest since 2008, when the last phase of sustained outperformance started (A).
WRE v IYR weekly chart
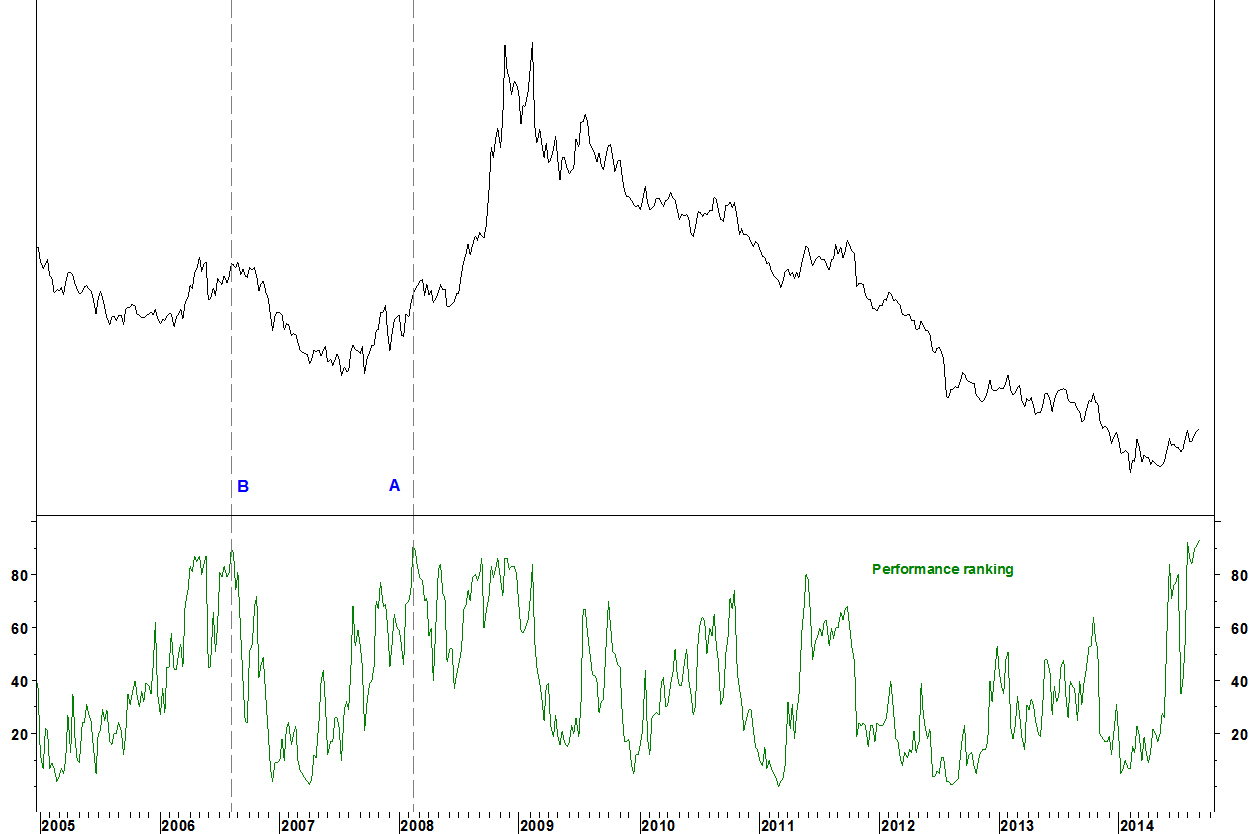
A similar PR level was reached in 2006 at B but there was not then the combination of factors (pending long term moving average crossover, previous bullish 14 week RSI divergence) that currently exist.
If, as I stated earlier today, the market indices are showing vulnerability, we should see sector rotations setting up that confirm this. Here are some involving the SPDR Consumer Staples (XLP) and the Nasdaq 100 Trust (QQQ).
SPDR Consumer Staples (XLP) vs SPDR S&P 500 (SPY)

- In February 2014, there was a bullish divergence on the 14 week RSI within that move down (against the January 2014 low)
- On a further move down now, there could be divergence across the lows to the early 2014 low
- There was this sort of divergence across the lows in March 2000, when the technology bubble peaked
PowerShares Nasdaq 100 (QQQ) vs SPDR S&P 500 (SPY)

- In April 2012, there was divergence against the September 2011 peak
- This set up is replicated now
- The daily RSI does not meet my ideal criteria. These were closer to being met in April 2012
Combining the two…
SPDR Consumer Staples (XLP) vs PowerShares Nasdaq 100 (QQQ)
- On a further fall, there will be bullish divergence across the lows
- The daily RSI criteria might also be met, the 30 July low had no divergence
In summary
This set up is not in place yet but we should look ahead for ideal scenarios. Not every low meets my ideal criteria and those needing to allocate sector weightings rather than placing this exact trade could already be making adjustments. If the RSI is shortened to 9 weeks, the divergence below 30 is already in place.
Footnote on earlier sector rotation
On 24 March, I showed the potential for the consumer discretionary sector to end its long term outperformance. Here is an update.
S&P 500 Consumer Discretionary Index v S&P 500 Index: daily chart
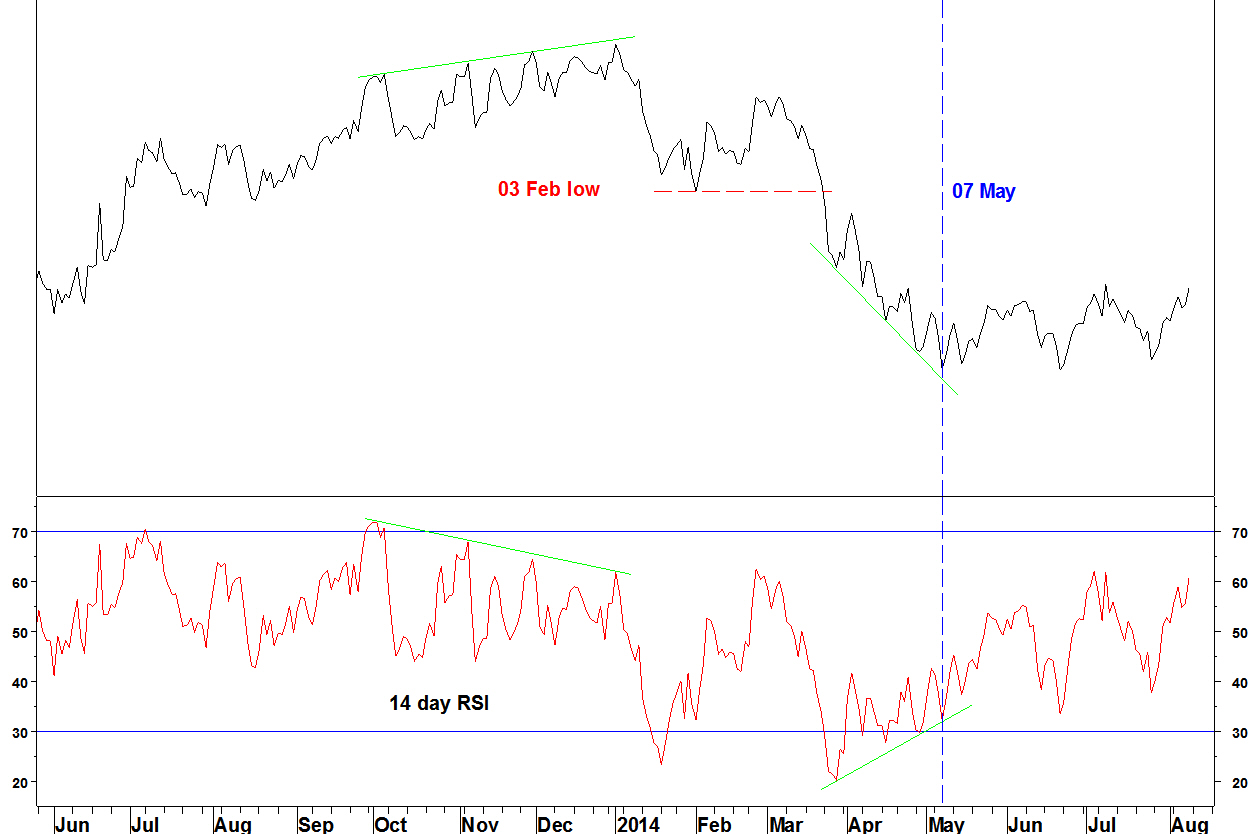
- The low of 03 February was broken and the long term moving average crossover occurred
- The low of 07 May was formed according to my daily RSI divergence criteria – successive divergences with the last one above 30
- I expect further relative weakness given the crossover and today’s other analysis. There is no specific good entry signal on this chart though
When looking for long term reversion and sector rotation candidates, a good method is to find charts with a pair of moving averages having not crossed for a long time, with a cross imminent. The longer without a cross, the more significant and reliable the impending cross is. The criteria are set out in my methods section.
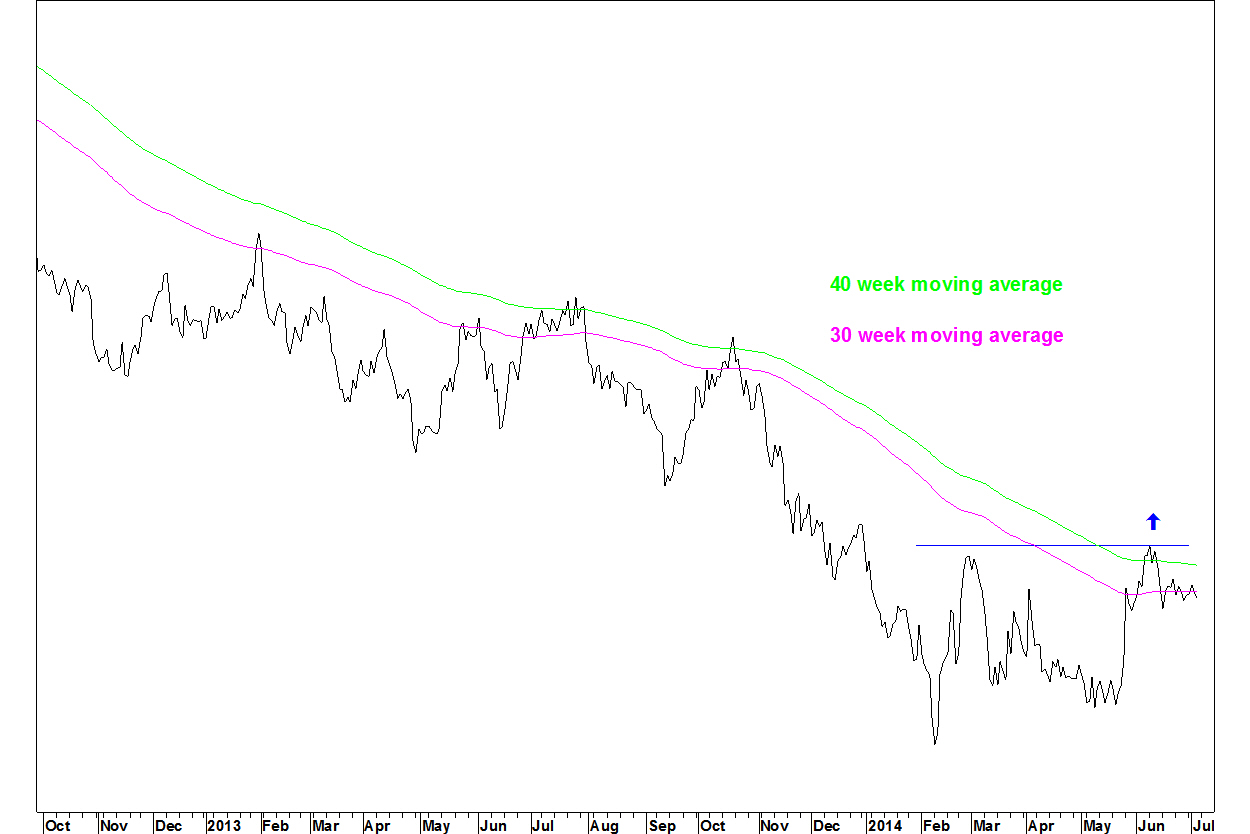
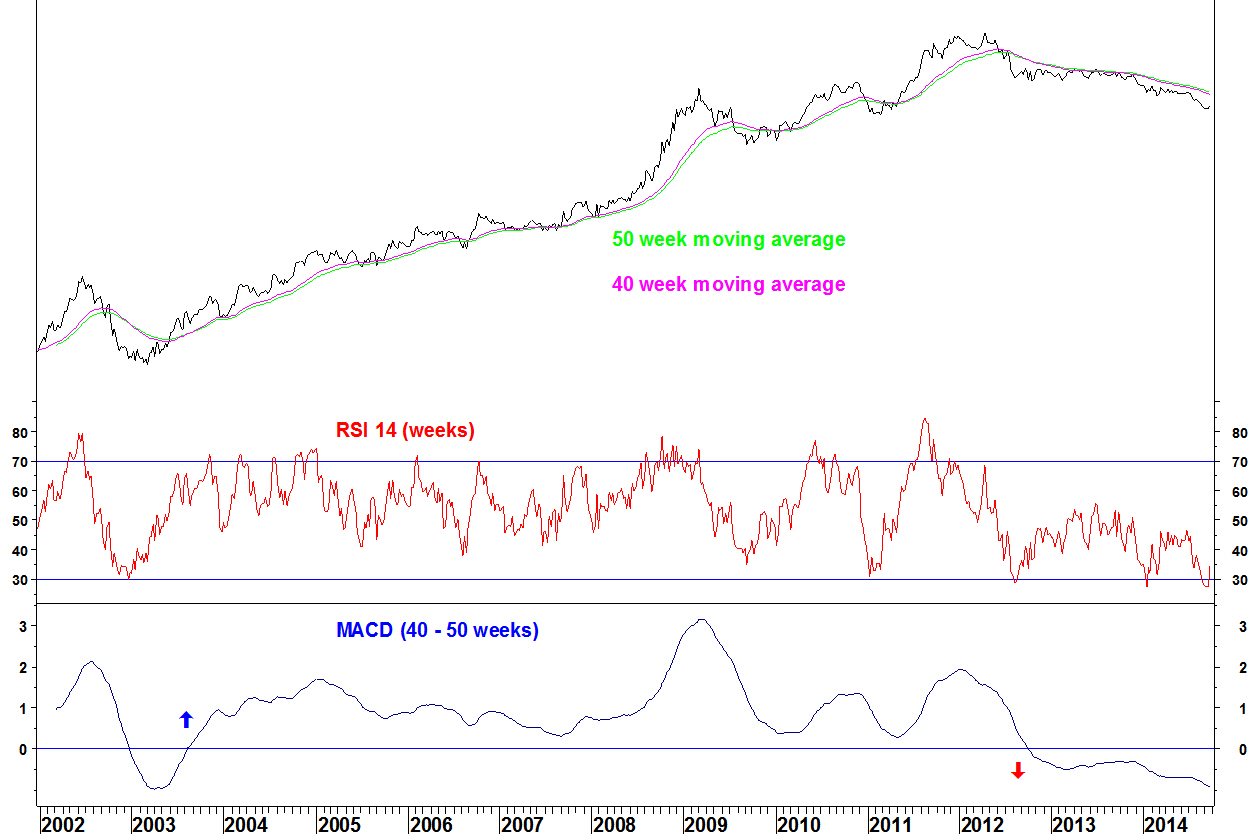
Market Vectors Semiconductor (SMH) versus PowerShares Nasdaq 100 (QQQ)
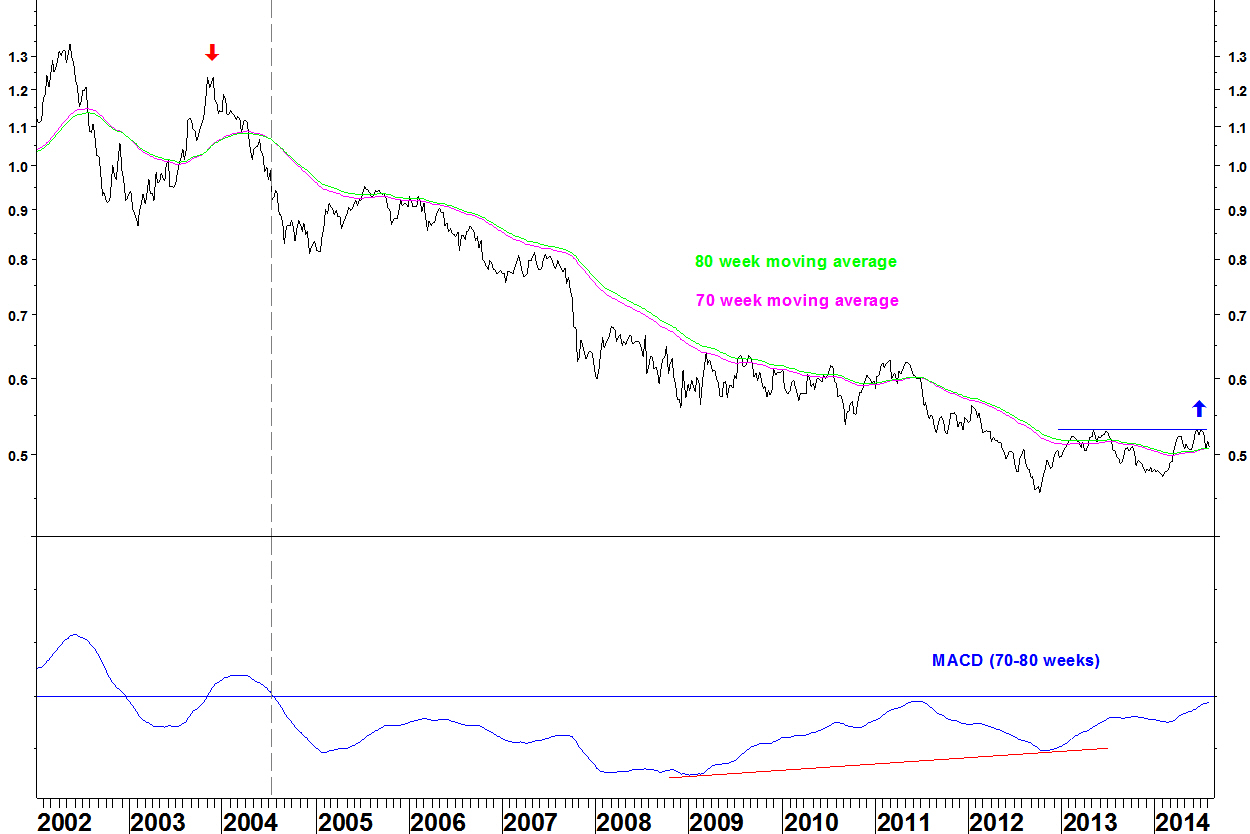
- The semiconductor ETF has underperformed the NASDAQ 100 ETF since May 2002 and consistently since November 2003 (red arrow)
- The ratio has lost 58.8% since November 2003
- The 70 and 80 week moving averages last crossed in July 2004
- The MACD indicator formed divergence at the October 2012 low
- The moving averages are close to crossing back over
- A break above the May 2013 and July 2014 highs (blue line) will be a mark of further progress
Note that a break higher is not a ‘buy signal’. Bases can take ages to develop, there could easily be a pull back lasting months. My Bollinger Band breakout method could give a signal but this works best with clearly trending moving averages, i.e. after the first consolidation above the base.
In summary
For those making long term asset allocations within the technology sector, the semiconductor sub sector looks ready to end its long term underperformance.
In my methods section, I state that divergences on the 14 week RSI have marked many important turns and this is the case not just for equity indices.
Nasdaq 100 Index
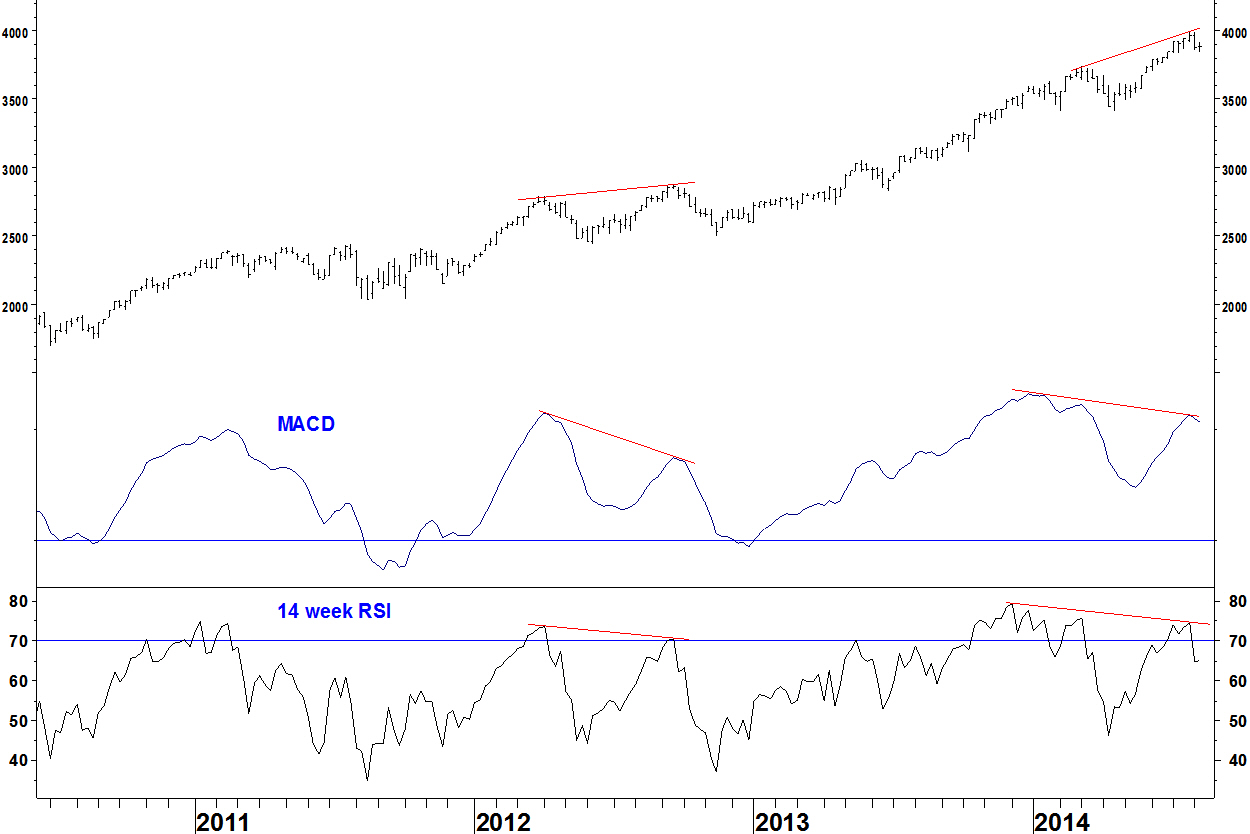
- The index formed divergences across the peaks of the 14 week RSI and the MACD in 2012, leading to an eight week decline
- The index has similar divergences now and the week ending 01 August moved the RSI back below 70
Monthly divergences
Monthly divergences on the RSI are even rarer and on the Dow Jones Industrial Average, have marked important turning points.
Dow Jones Industrial Average

- The index showed divergence in December 1999, although this was not the first monthly divergence in that advance
- There was a form of divergence in October 2007, although the intervening RSI low was above 70 (does that really matter?)
- The index has now formed a monthly RSI divergence and July was a reversal month, moving higher before finishing below June’s close (and low)
Historically, monthly RSI divergences marked turns in:
August 1987 – before the crash
December 1974 – the bear market low
February 1966 – a high not conclusively beaten until 1982
January 1960 – a high not beaten for 16 months
May 1946 – a high not beaten for four years
August 1929 – although the intervening RSI low was above 70 (does that really matter?) and there were other divergences on the way up that were blown away
So there are more monthly divergences than market peaks but history shows they are worth heeding.
In mid June, I showed Vornado Realty Trust (VNO) setting up against iShares U.S. Real Estate (IYR). I will update the situation and set out the trade entry criteria.
Vornado Realty Trust (VNO) v IYR
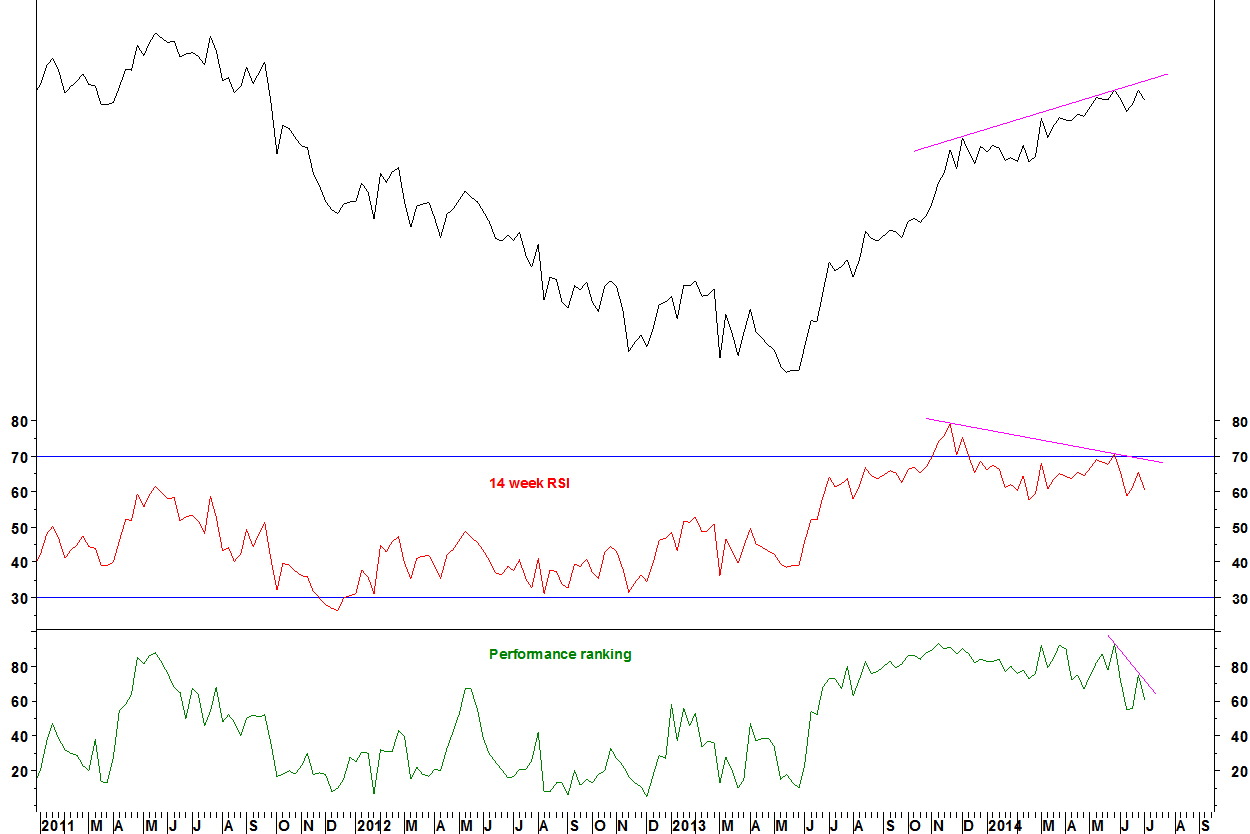
- The late May 14 week RSI bearish divergence remains in place, along with MACD divergence (not shown here)
- A marginal new weekly closing high was formed on the ratio on 27 June, which had divergence on the Performance Ranking (PR)
Daily chart
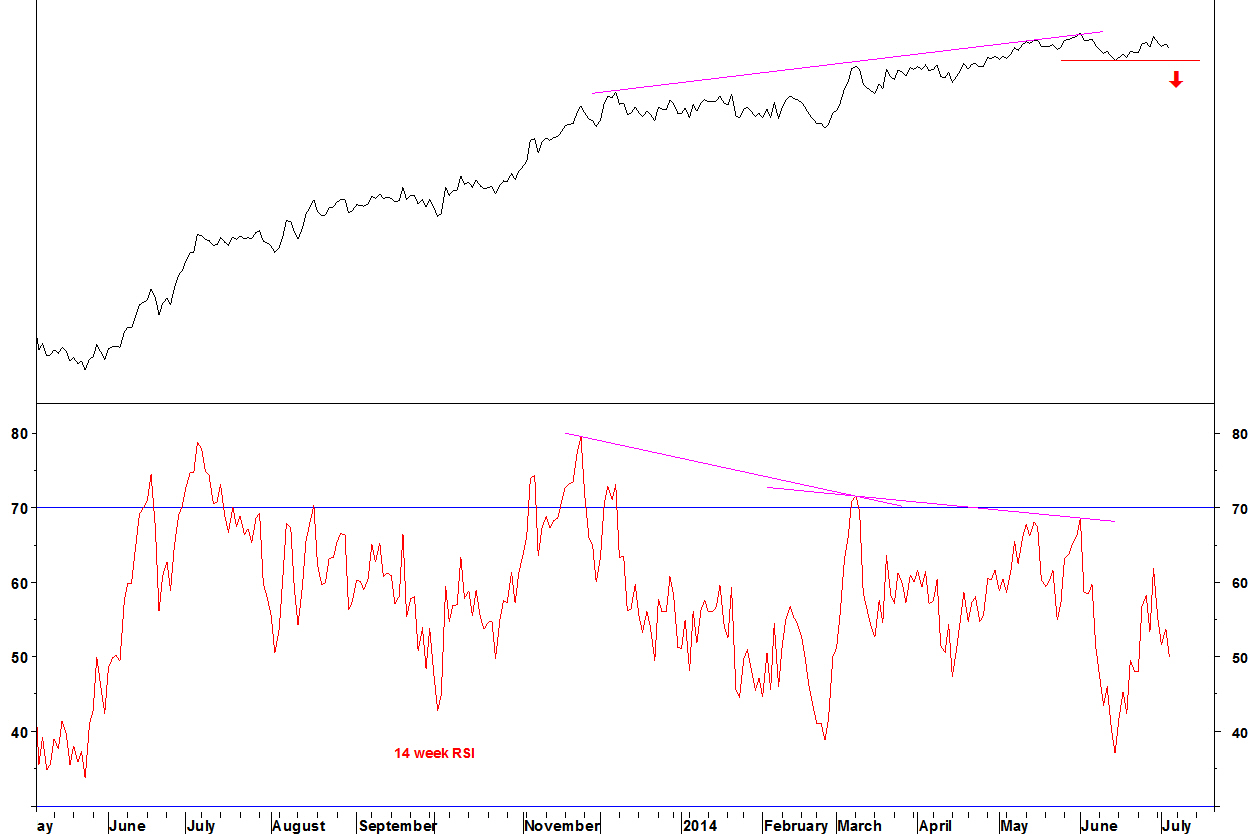
- The ideal daily RSI divergence criteria have been met
- The daily closing high for the ratio was on 02 June at 1.49749
- A break below the 13 June low of 1.46605 (below the red line) will be a sell signal
- Earnings for VNO are released on 04 August (this can be checked on www.thestreet.com/event-calendar/index.html). This gives time for the trade to be triggered and run for a few weeks before earnings. Don’t open trades right near earnings releases
Summary
A short position in VNO v IYR will be opened on a daily close below the 13 June low. The stop loss is a daily close above the 02 June high (2.14% higher)
Update on Washington Real Estate (WRE)
I showed WRE v IYR on 09 June. I noted that long term investors may wait for a moving average crossover as a signal on this and the broader market (given WRE’s defensive nature). This might take a while but the next thing to look for is a break above the 09 June high. Even then, this will not be a defined entry signal, the base could take longer to form.
WRE v IYR daily chart