Sector rotations: Consumer staples, technology and consumer discretionary
If, as I stated earlier today, the market indices are showing vulnerability, we should see sector rotations setting up that confirm this. Here are some involving the SPDR Consumer Staples (XLP) and the Nasdaq 100 Trust (QQQ).
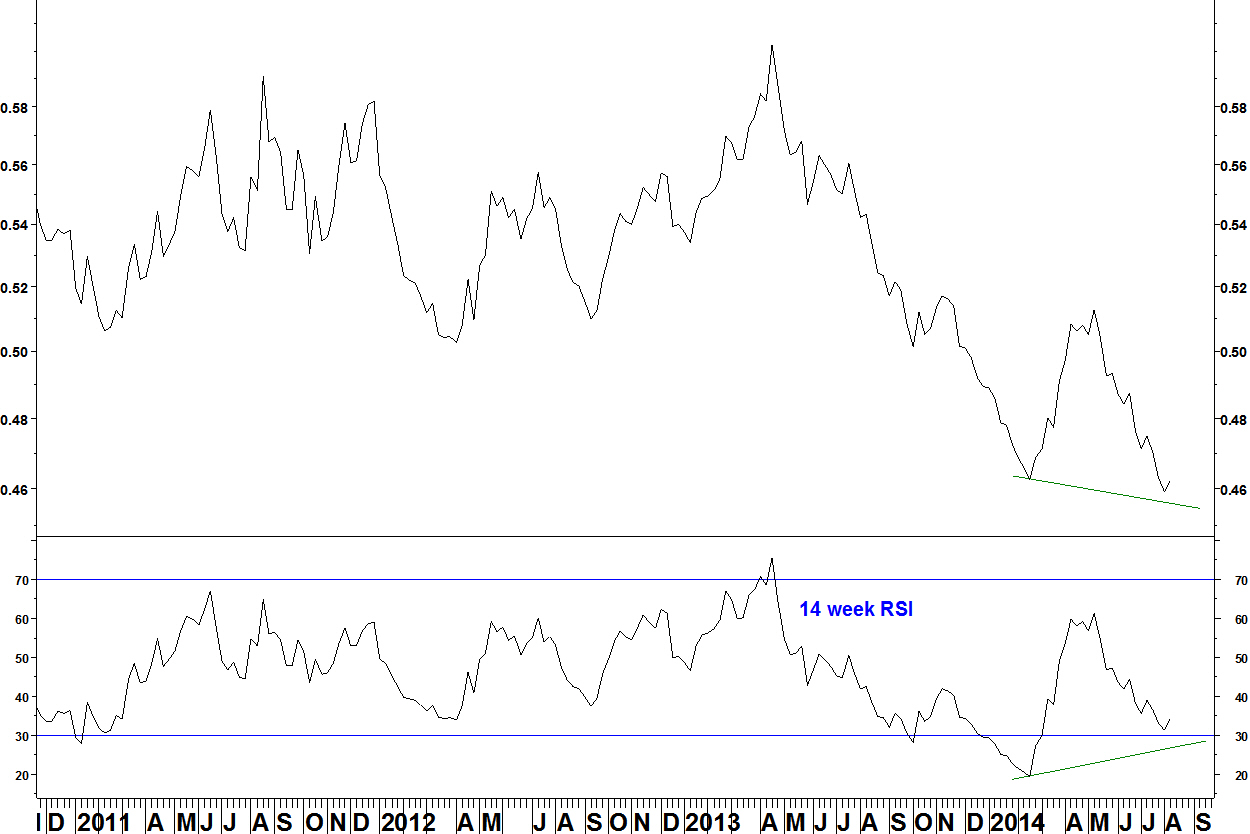
SPDR Consumer Staples (XLP) vs SPDR S&P 500 (SPY)

- In February 2014, there was a bullish divergence on the 14 week RSI within that move down (against the January 2014 low)
- On a further move down now, there could be divergence across the lows to the early 2014 low
- There was this sort of divergence across the lows in March 2000, when the technology bubble peaked
PowerShares Nasdaq 100 (QQQ) vs SPDR S&P 500 (SPY)

- In April 2012, there was divergence against the September 2011 peak
- This set up is replicated now
- The daily RSI does not meet my ideal criteria. These were closer to being met in April 2012
Combining the two…
SPDR Consumer Staples (XLP) vs PowerShares Nasdaq 100 (QQQ)
- On a further fall, there will be bullish divergence across the lows
- The daily RSI criteria might also be met, the 30 July low had no divergence
In summary
This set up is not in place yet but we should look ahead for ideal scenarios. Not every low meets my ideal criteria and those needing to allocate sector weightings rather than placing this exact trade could already be making adjustments. If the RSI is shortened to 9 weeks, the divergence below 30 is already in place.
Footnote on earlier sector rotation
On 24 March, I showed the potential for the consumer discretionary sector to end its long term outperformance. Here is an update.
S&P 500 Consumer Discretionary Index v S&P 500 Index: daily chart
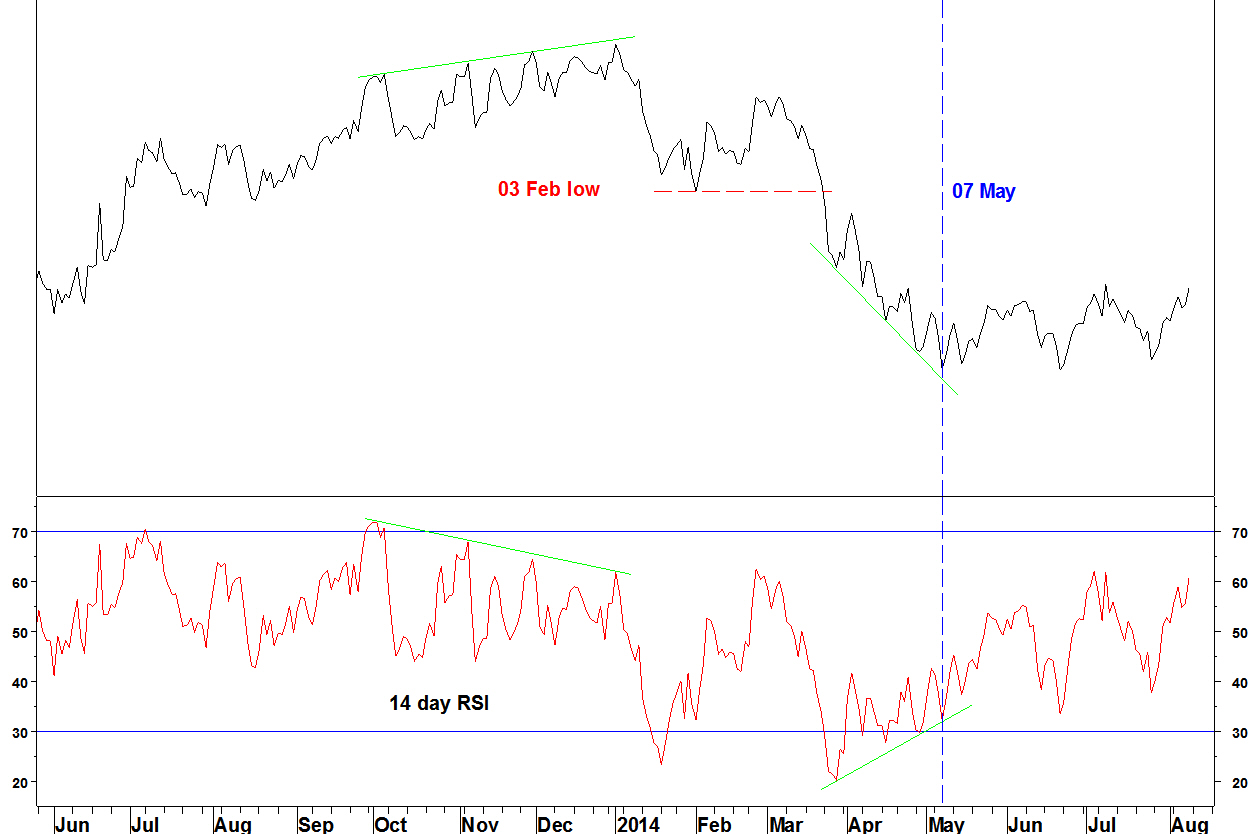
- The low of 03 February was broken and the long term moving average crossover occurred
- The low of 07 May was formed according to my daily RSI divergence criteria – successive divergences with the last one above 30
- I expect further relative weakness given the crossover and today’s other analysis. There is no specific good entry signal on this chart though
