Semiconductors to end long term technology sector underperformance
When looking for long term reversion and sector rotation candidates, a good method is to find charts with a pair of moving averages having not crossed for a long time, with a cross imminent. The longer without a cross, the more significant and reliable the impending cross is. The criteria are set out in my methods section.
Market Vectors Semiconductor (SMH) versus PowerShares Nasdaq 100 (QQQ)
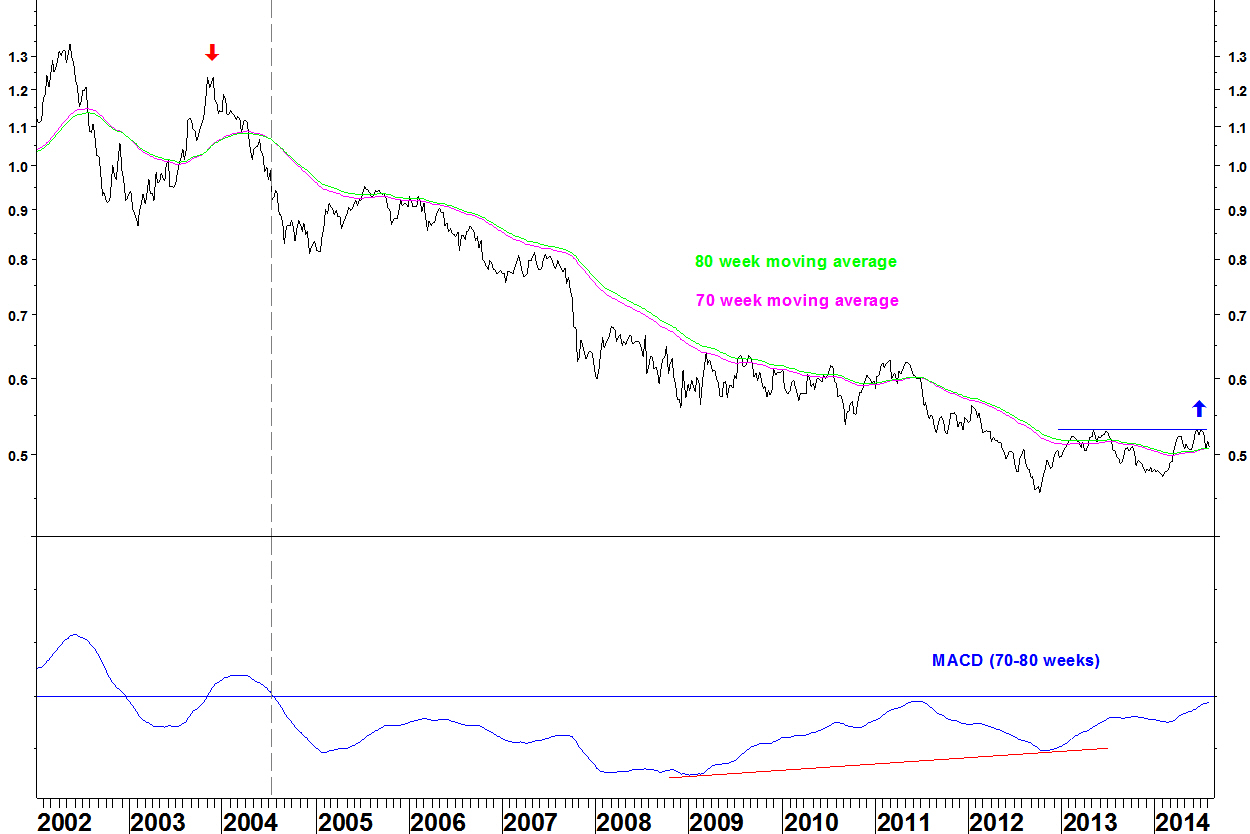
- The semiconductor ETF has underperformed the NASDAQ 100 ETF since May 2002 and consistently since November 2003 (red arrow)
- The ratio has lost 58.8% since November 2003
- The 70 and 80 week moving averages last crossed in July 2004
- The MACD indicator formed divergence at the October 2012 low
- The moving averages are close to crossing back over
- A break above the May 2013 and July 2014 highs (blue line) will be a mark of further progress
Note that a break higher is not a ‘buy signal’. Bases can take ages to develop, there could easily be a pull back lasting months. My Bollinger Band breakout method could give a signal but this works best with clearly trending moving averages, i.e. after the first consolidation above the base.
In summary
For those making long term asset allocations within the technology sector, the semiconductor sub sector looks ready to end its long term underperformance.
