Bearish developments for the NASDAQ 100 Index
There is bearish breadth divergence for the components of the NASDAQ 100 Index. I have breadth data for the major US indices, based on the percentage of stocks above differing period moving averages. This is sourced from Pinnacle Data and was introduced on 07 May 2012.
NASDAQ 100 Index and %age of stocks above their 50 day moving average

- The new high comes with fewer stocks above their 50 day moving average than in July
- There were bearish divergences at the peaks in April 2012, September 2012 and March 2014. Not all came on the first divergence, so be aware that divergence can persist before a peak
- Price lows since October 2011 have come with breadth at around 20%, it currently stands at 54%
- The same chart for the S&P 500 Index components shows the same current feature. This breadth divergence is a broader market characteristic
NASDAQ 100 Index relative to other market indices
Other indices have underperformed the NASDAQ 100 Index but now have bullish RSI divergences against the NASDAQ 100 Index.
S&P 100 Index (large caps) vs NASDAQ 100 Index
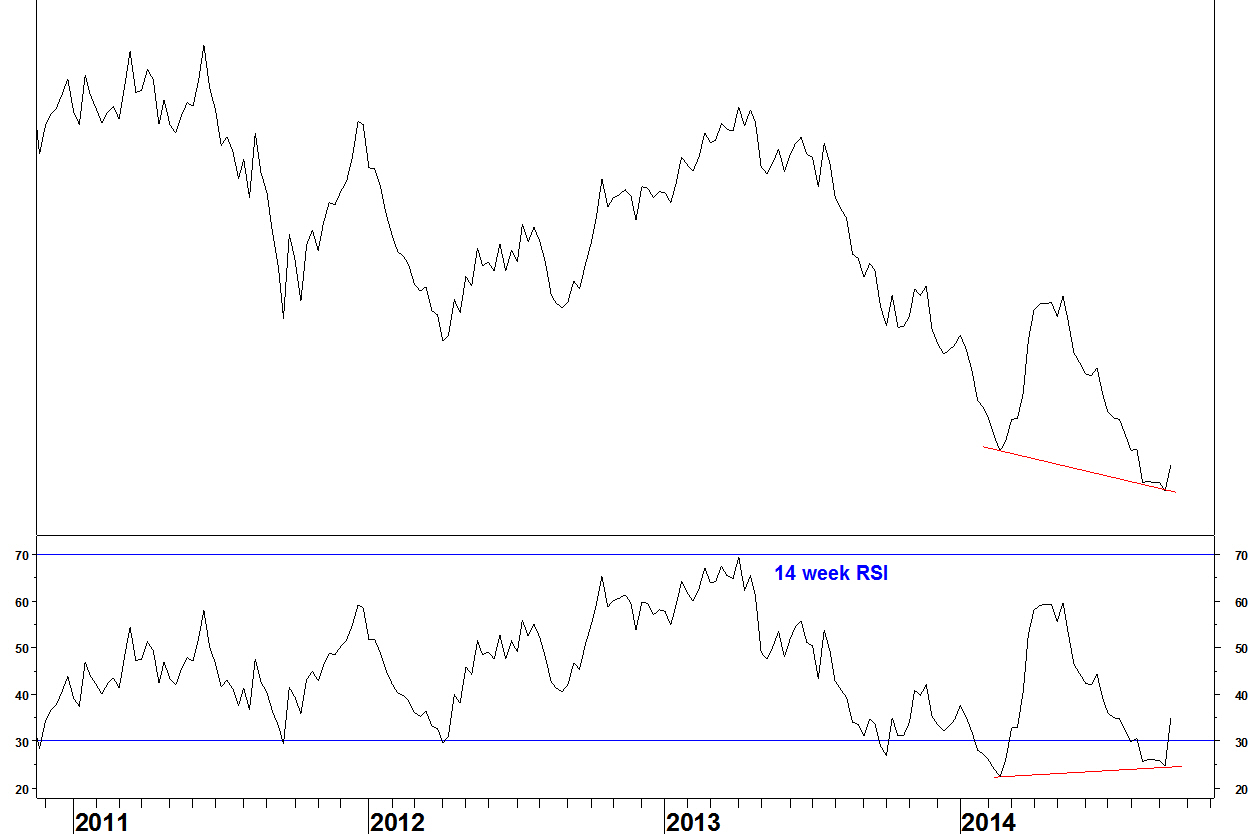
- There is bullish divergence across the troughs for this ratio
- The ratio has broken a four month downtrend and the RSI has moved above 30
S&P 400 Index (mid caps) vs NASDAQ 100 Index
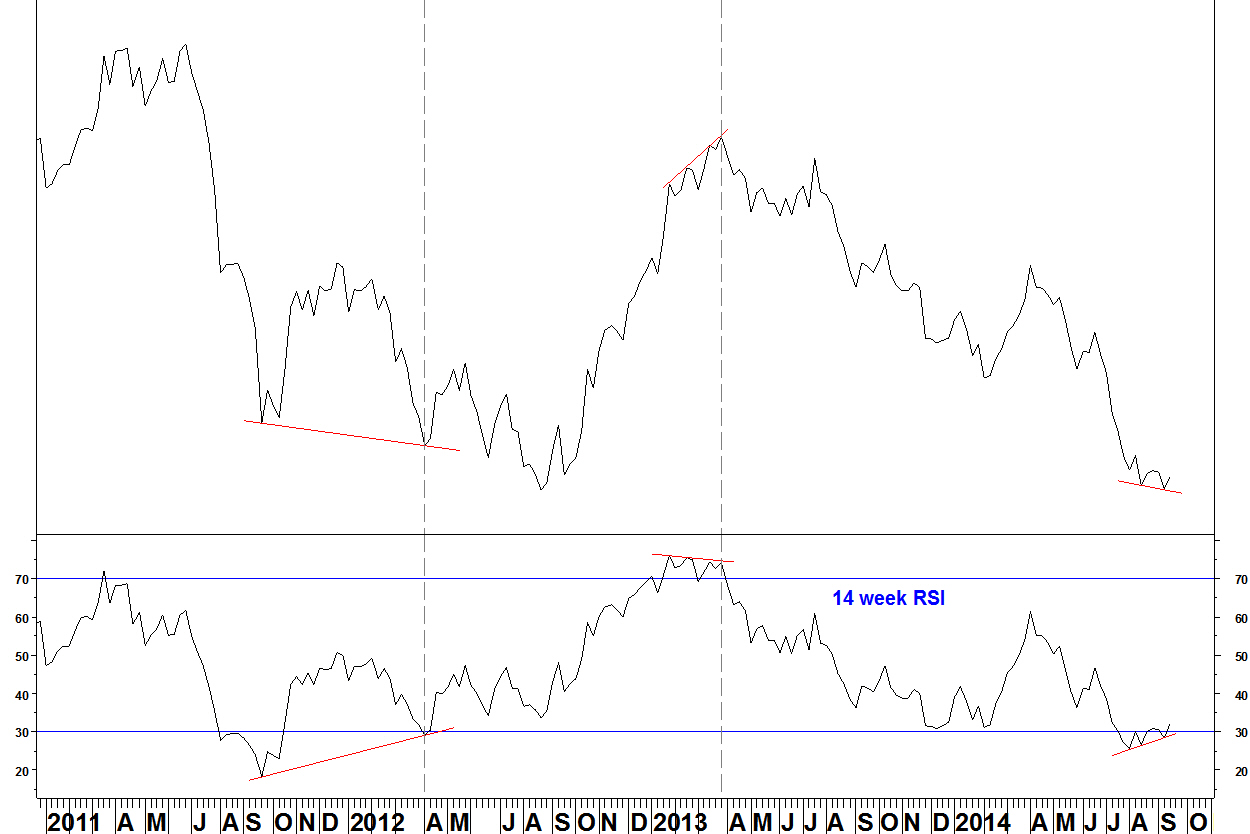
- There is bullish divergence within this trough against the August low. RSI has moved above 30
- This is a similar set up (in reverse) to the bearish divergence in early 2013
- There was bullish divergence across the troughs in April 2012, which prompted a seven week rally but was not a long term low
Summary
Market index breadth divergences suggest that at least a short term peak is here and ratio charts suggest that the NASDAQ 100 Index will underperform for at least the next few months
