Wal-Mart forms bullish RSI divergence versus NASDAQ 100
Last week, I showed how the NASDAQ 100 Index was in position to underperform other indices, which had bullish RSI divergence against the NASDAQ. I can then scan for long side candidates for this pair which match my RSI divergence criteria. Wal-Mart (WMT) meets these criteria exactly.
Wal-Mart (WMT) v NASDAQ 100 Trust (QQQ)
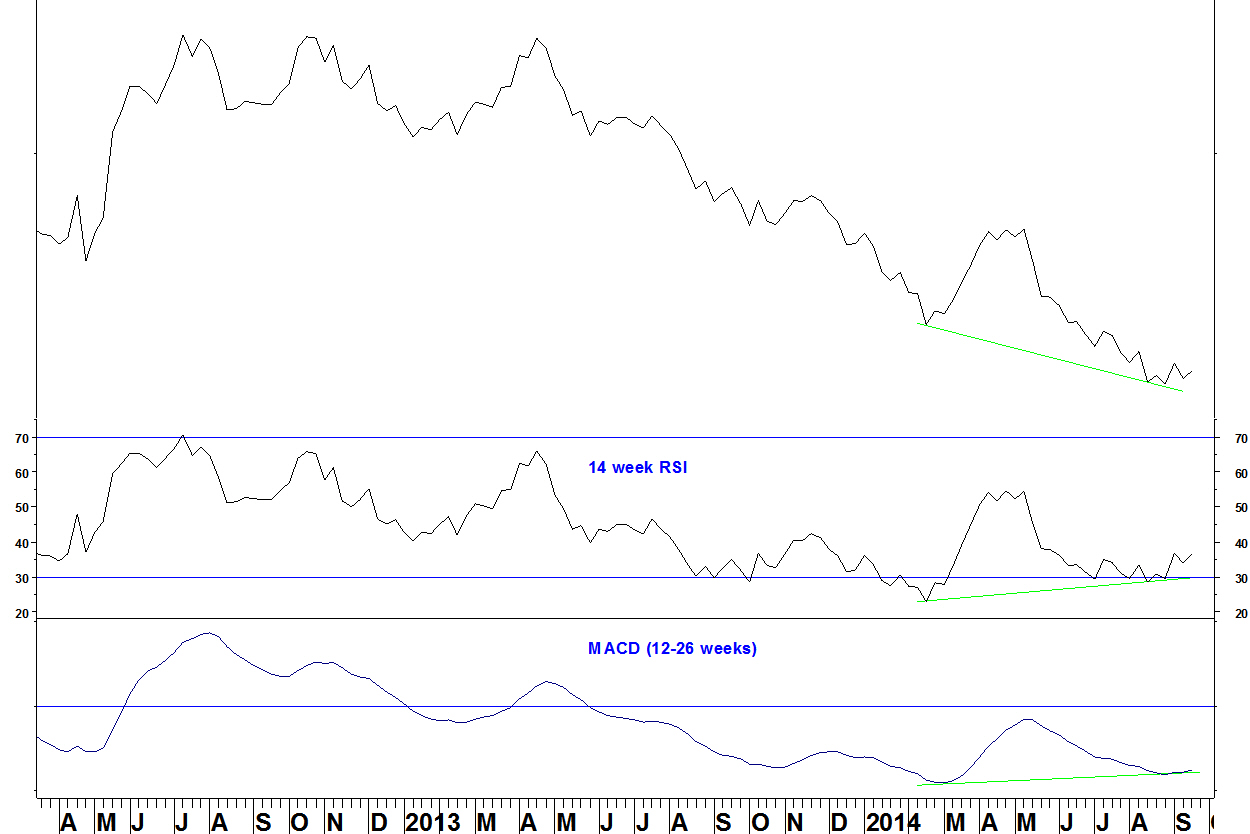
- The pair has been in a downtrend since April 2013 and has lost 33.2%
- There is bullish divergence against the February low on the 14 week RSI and the MACD
- There was bullish divergence within this low, against the 15 August low
Daily chart

- The low of 29 August (dashed line) was a bullish RSI divergence above 30 after divergences below 30 had been formed. This matches the RSI divergence criteria
- A similar divergence had formed at the late April high
- A break above the 05 September high of 0.77595 (red line) will complete the short term trend change
- A daily close above 0.77595 will be used as an entry signal. The stop loss will be a close below the 29 August low (2.5% lower)
Summary
- Buy the pair WMT versus QQQ on a daily close above 0.77595, with a stop loss as an end of day close below the low of 0.75666
- Earnings for WMT are not until mid November, I try to avoid trading stocks with upcoming earnings and there is plenty of time before this
Leave a Comment
