My methods applied to the US Real Estate sector
The blog has taken a bit of a back seat with various other things going on. I’m going to show some current examples of my methods using components of the iShares US Real Estate (IYR), starting off with a defensive stock.
Methods shown:
RSI divergences
Long term moving average crossovers
Performance Rank (PR) divergences
Washington Real Estate (WRE) v IYR
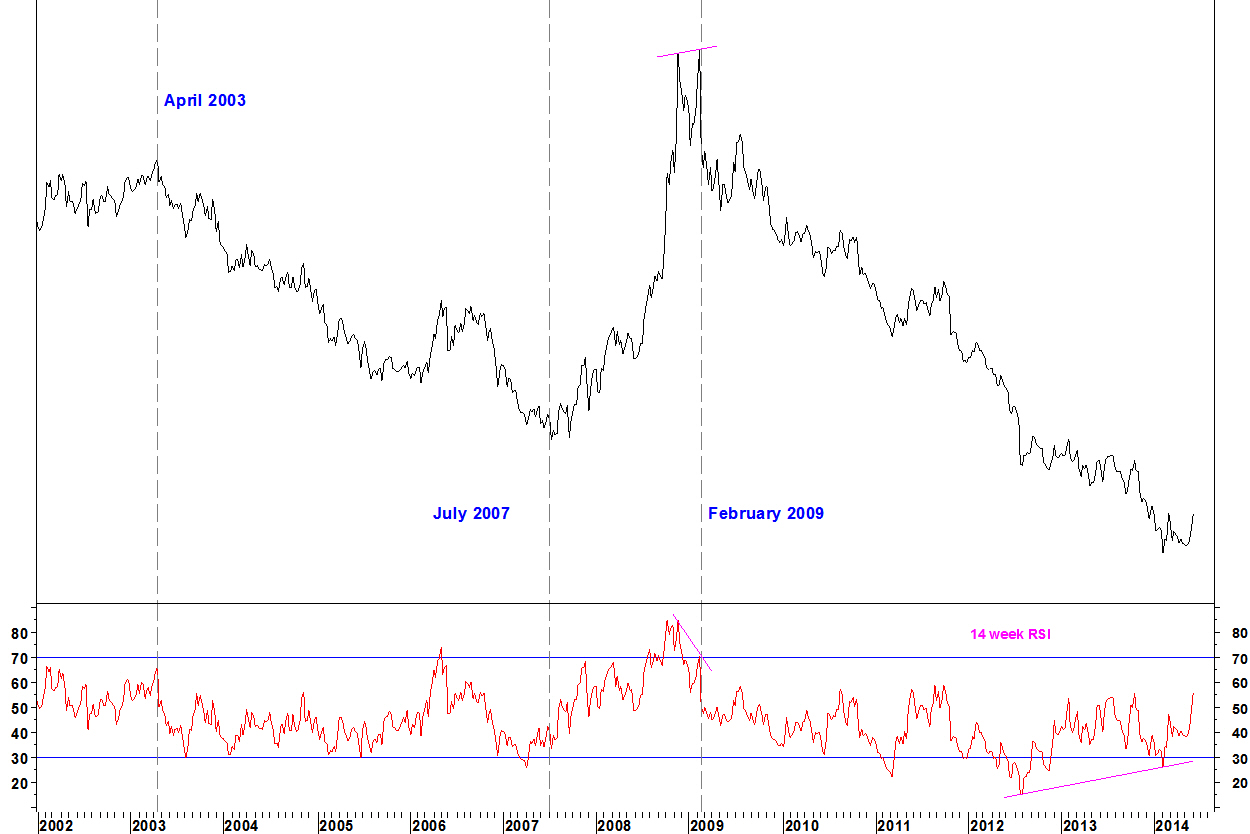
- WRE outperforms IYR in bear markets and underperforms in bull markets
- The relative had a bearish RSI divergence at the high of February 2009
- The late 2012 bullish divergence did not stop the decline (so divergences aren’t flawless) but another RSI divergence formed in February 2014 against the summer 2012 low
Long term moving average chart: WRE v IYR
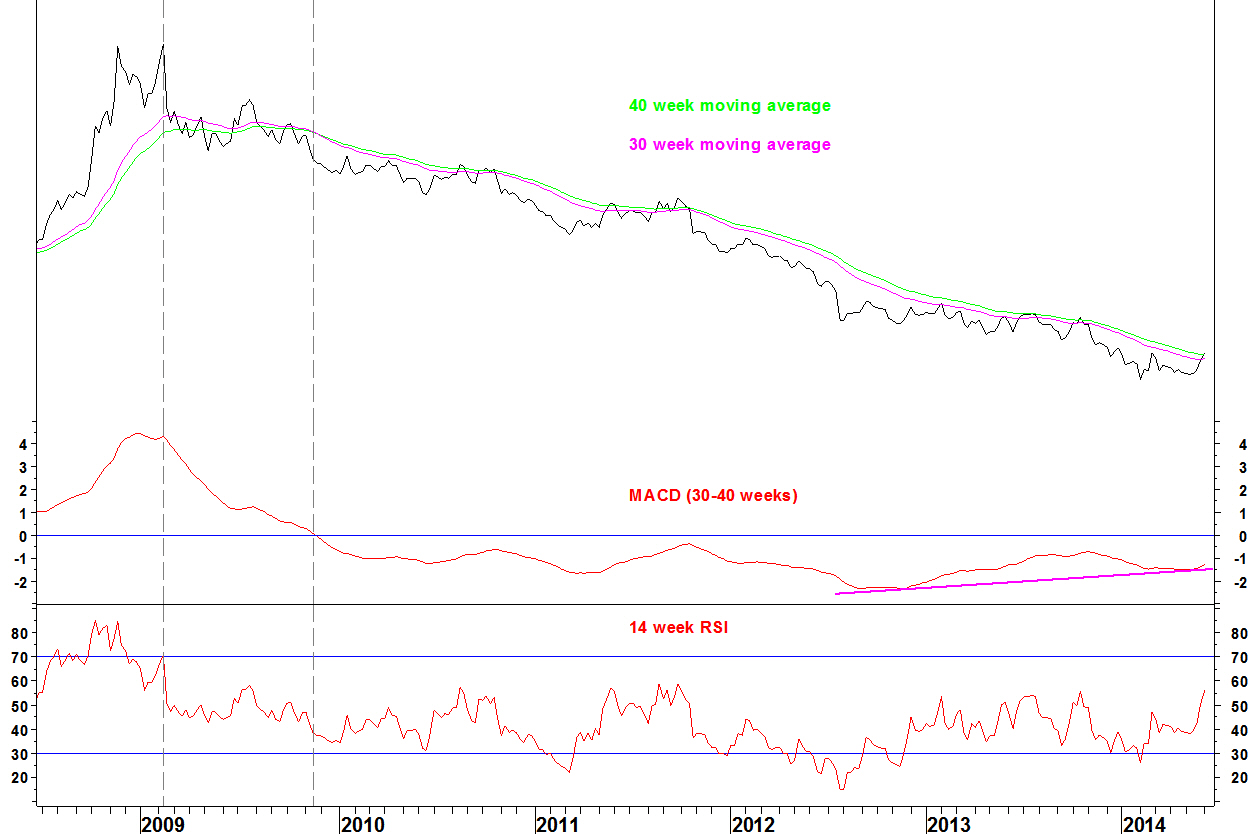
- The 30 and 40 week moving averages have not crossed in over four years
- There is now bullish divergence on the MACD (this is a %age difference MACD, so doesn’t show divergence just because the ratio gets smaller)
Longer term investors in the sector or those looking for clues on the broad market might want to wait for a moving average crossover.
Short term Performance Ranking chart: WRE v IYR
Knowing that the longer term developments are taking shape, shorter term traders could have used the Performance Rank (PR) as confirmation of the short term break higher.

- From 09 April, WRE showed an improving PR (its price performance compared to all other components of IYR), despite the relative low being one month later
- When the relative line moved to a six week high, this was confirmed by the PR moving to a 2014 high. A short term overweight position in WRE in the sector could have been taken
More examples from the US real estate sector will follow in the coming weeks.
