The short position in Hess Corp (HES) v SPDR Energy (XLE) has a 2.9% profit as of Monday’s close. The position will be closed because Hess Corp reports earnings on Wednesday and I resolved to close these positions before earnings to reduce risk. I want to trade the set ups that I have identified, not the earnings announcements.
Hess Corp (HES) v SPDR Energy (XLE)
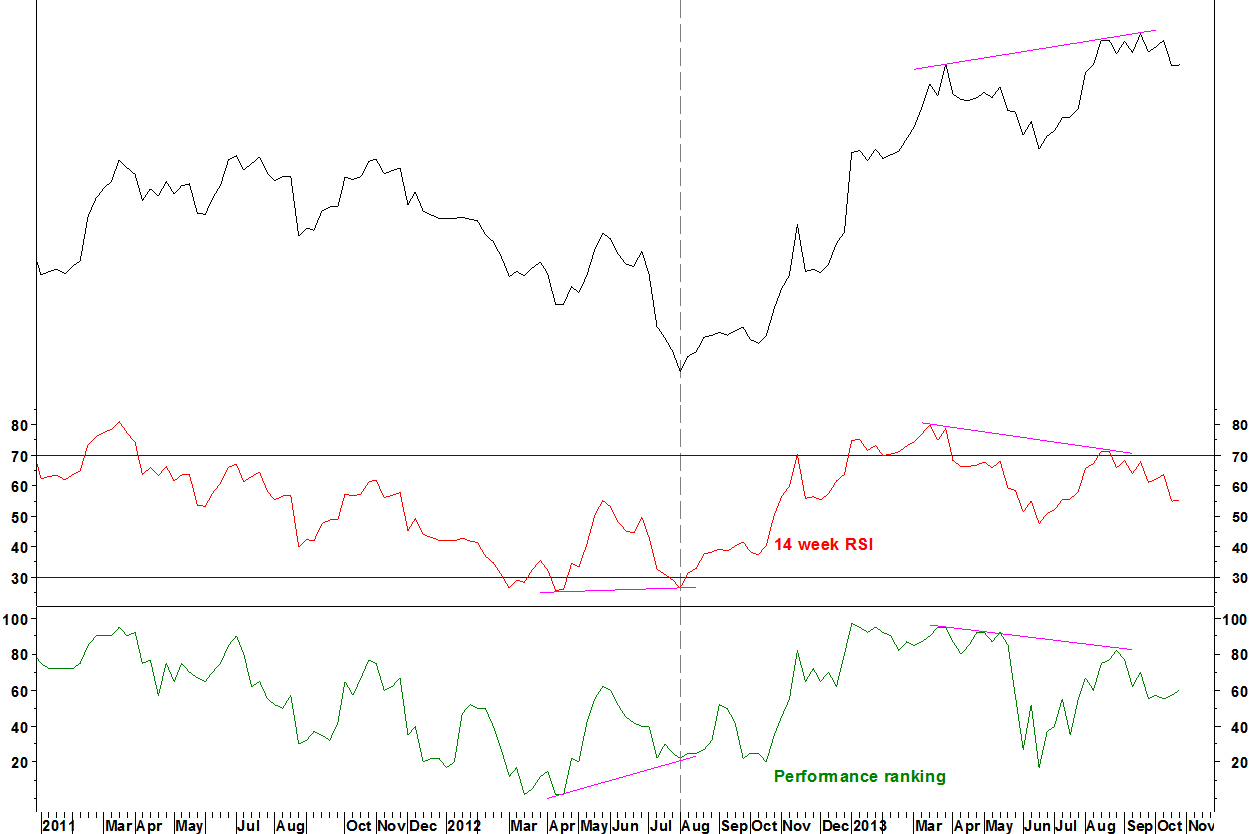
The last dashed line shows when the RSI and Performance Rank divergence were identified (in October). We may get more downside but that is not something that can be predicted through my method, which identifies the divergence set up.
Restaurants sector relative short position
This was entered on 17 December (dashed line) on a break of relative support. The trade has progressed well but became short term oversold. The stop loss is moved to break even.
Daily chart
I am looking for more downside on this. Recall that there has been a long term moving average crossover on this trade, so plenty of reversionary potential.
In October, I showed that British American Tobacco (UK: BATS, US: BTI) was ending its long term outperformance of some UK large cap stocks.
On price, the first moving average crossover since September 2009 is imminent.
BATS price (US: BTI)

Moving average crossovers had happened against GlaxoSmithKline, HSBC and Barclays. I recommended waiting for a Bollinger Band breakout on these pairs to identify the timing of the next move in these long term rotations.
As discussed in my December article on the restaurants sector though, the Bollinger Band method should have:
- Bands that have recently contracted rather than dribbled together for months
- Bands with a track record of providing good signals on that chart
This is more likely in a trend continuation situation than a break above a long term base, so this method is not really applicable here. Instead, just going with a decisive resistance break has to be the signal.
Barclays (BCS) v BATS (BTI) daily chart

- The long term moving average crossover happened in January 2013 at X.
- The pair has since traded sideways
- The first ‘Bollinger Band breakout’ (on 40 week bands) occurred in October 2013 at Y, but failed to hold. One possible reason is the 14 day RSI was not strong enough, showing a divergence
- Now, all resistance has been broken with no daily RSI divergence, so this breakout has a better chance of working
Alternative tactics
An alternative tactic on long term moving average crossovers is to try to buy the bottom of the range. In early November 2013 (at Z), the daily RSI was oversold and the pair was at the support level. The moving average crossover had held for nine months and the pair traded above its 2011/12 base.
In summary
- Long term moving average crossovers take a long time to play out
- Timing their advance with a Bollinger Band breakout method can be problematic
- An alternative tactic is to try to buy the bottom of the range using a daily RSI.
- The crossover having held in place for a while should provide confidence that it will remain in place
Here, I will review the following factors for the telecom sector:
- Sector against the S&P 500 Index
- Performance of components against the sector
- Sector breadth
In summary
- The telecom sector continues to underperform the S&P 500 Index. There is no momentum divergence for this underperforming trend
- AT&T has underperformed the iShares US Telecom (IYZ). Watch for an end to this underperformance
- There are bearish divergences on two long term breadth indicators for IYZ
- A shorter term breadth indicator became overbought at Christmas and has further to fall
SPX 500 Integrated Telecom Services vs. S&P 500 Index

- The telecom sector has underperformed the S&P 500 Index since August 2012 (point B)
- There is no divergence on the 14 week RSI, which is something to look for as a trend ending indicator
- The Performance Rank (PR) of the sector amongst a range of sectors remains low, with only a slight bullish divergence
In my Performance Ranking method, I rank sector indices by price performance, then look for divergences between relative strength and Performance Rank. I also look for an RSI divergence to back this up.
The telecom sector does not meet my criteria for identifying high probability reversion candidates.
In my ideal criteria, the RSI divergence forms above 70 or below 30. In early 2009, this was not the case but the divergence still worked. Other factors, such as commonality amongst defensive sectors were more important. Exact criteria can always be reviewed and altered.
Performance rank of components of iShares US Telecom (IYZ)
Using my Performance Ranking (PR) method, I also rank sector components and look for divergences. Here is an example from the energy sector
AT&T (T) vs. IYZ
- The relative line made a new low in December, with bullish divergences on the RSI and PR
- Watch for improved relative strength for AT&T against its sector
Breadth for the iShares US Telecom (IYZ)
IYZ and %age of components above 200 day moving average

- Peaks for IYZ came with divergences for the %age of component stocks above their 200 day moving average in 2007 and 2011
- There is now another divergence on this indicator
Caveats
- Not all divergences end up being peaks. Sometimes the divergence is blown away, like in September 2010 and May 2013
- This indicator has been calculated on the current components of IYZ
IYZ and %age of components with 50 day moving average above 200 day average

- This indicator showed bearish divergences at the 2007 and 2011 peaks
- There was a bullish divergence at the 2008/09 low, which took four months to take effect
- There is another bearish divergence on this indicator
IYZ and %age of components above 100 day moving average

- Shorter period moving average breadth often works as a range bound overbought/ oversold indicator
- Since 2011, moves for this breadth indicator to 80% have coincided with or shortly preceded ends of rallies
- Sometimes there is divergence at the peak (B and E), sometimes waiting for breadth to fall below 80% is a good sell signal (C and F)
- On 26 December 2013 (G), breadth reached 80% and fell the next day. This was a profit taking opportunity, confirmed on 02 January
- The last two buying opportunities (late August and mid December) have come with breadth just below 50%. Breadth is now 64%
- The long term breadth divergence might mean that a fall below 50% does not lead to give a good buying point
This is just a quick update to tidy up for the year.
The short position in Hormel Foods (HRL) v SPDR Consumer Staples (XLP) was stopped out at break even. As I have discussed on here many times, trades should be closed before earnings releases and the case for this is strengthened if there is an RSI divergence that suggests a reversion anyway.
Daily chart
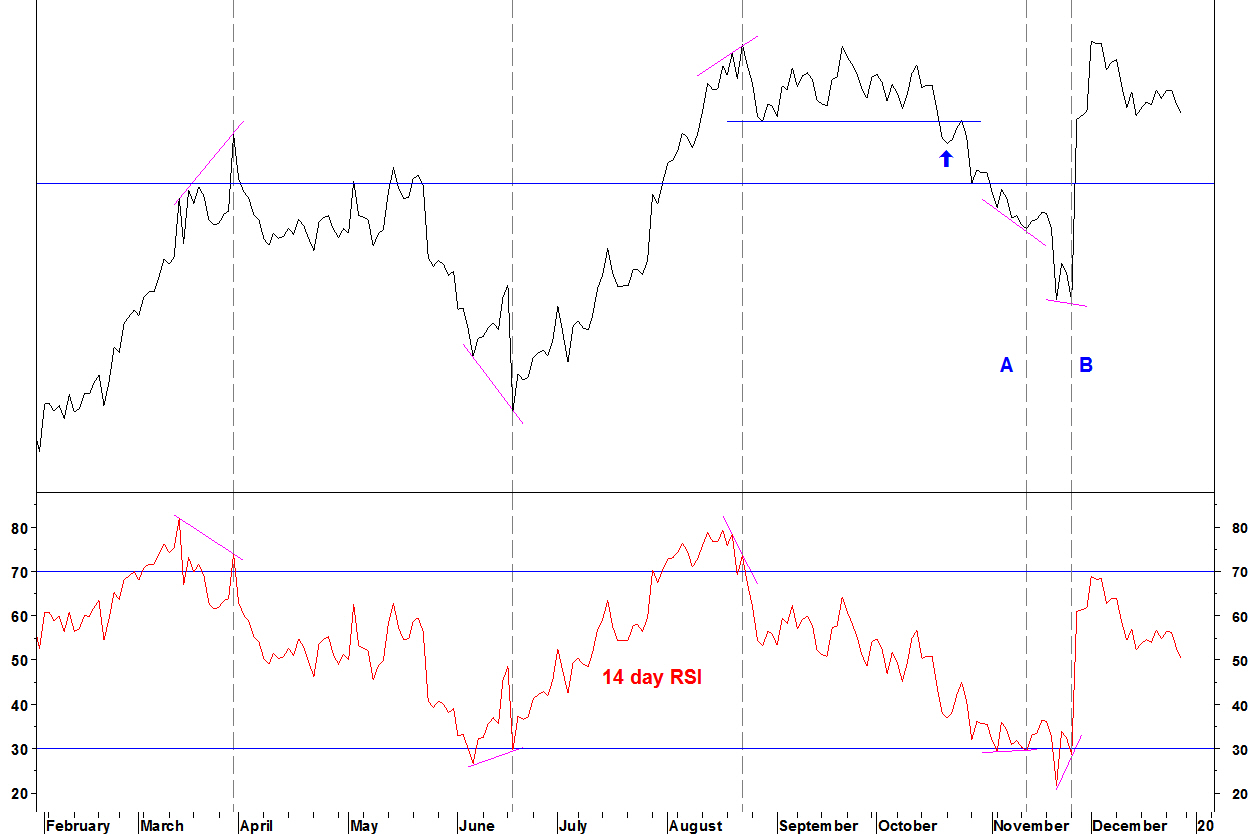
- The stop loss had been moved to break even at A, on the first bullish daily RSI divergence
- There was another bullish daily RSI divergence at B, the day before the results were released, two reasons to close the trade
Restaurants sector relative short trade
This was opened in mid December and makes modest progress.
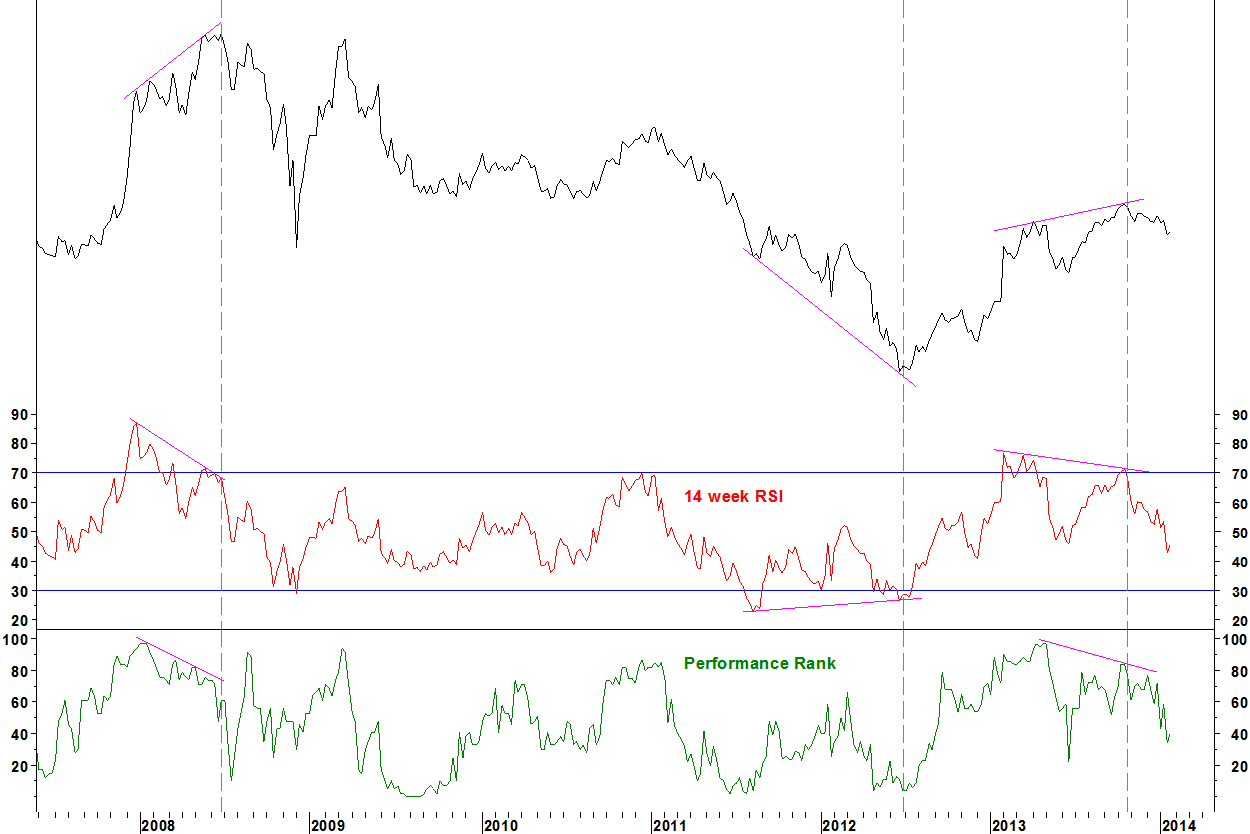
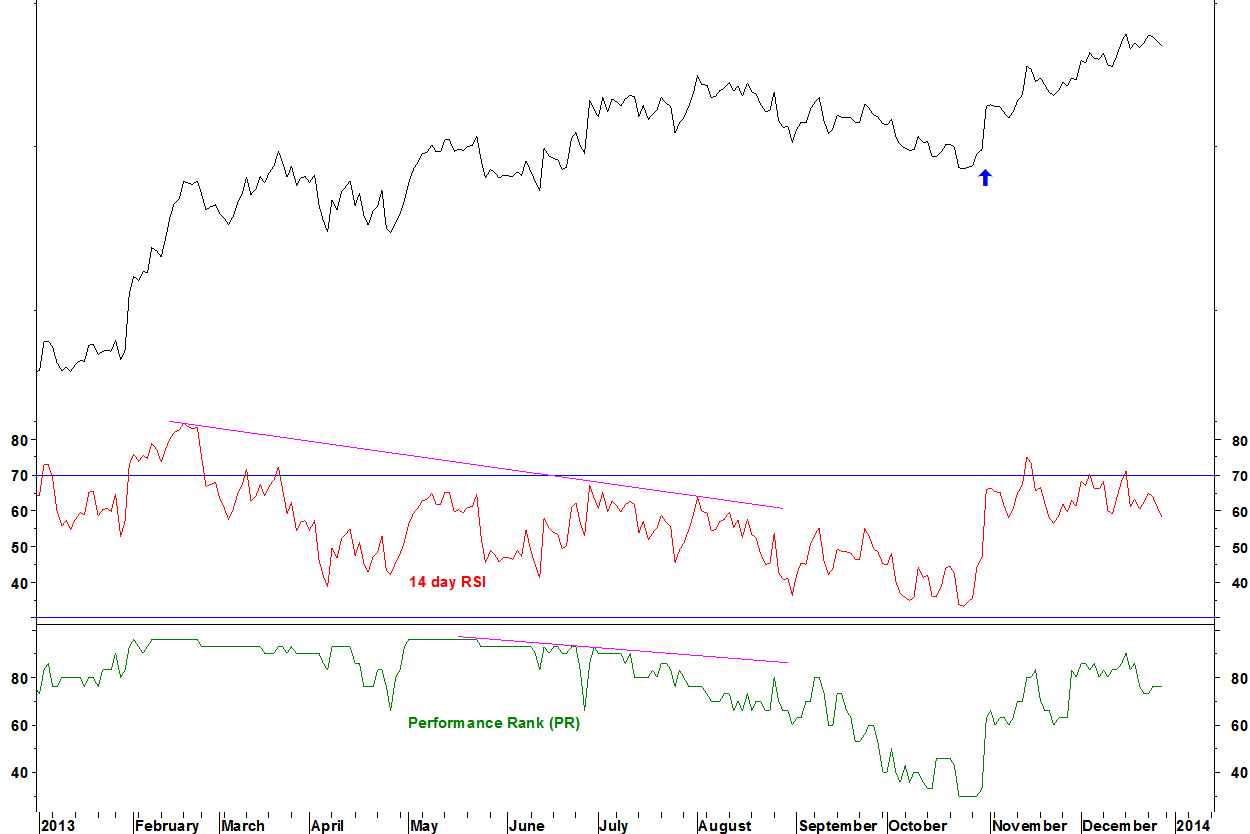
Hess Corporation (HES) v SPDR Energy (XLE)
This trade is still in place, waiting for the longer term divergence to take effect
Owens Illinois v SPDR Materials (XLB)
This relative short sector trade was closed before results were announced on 30 October (blue arrow) and has since rallied, again showing the value of closing trades before results.
Owens Illinois v SPDR Materials (XLB)
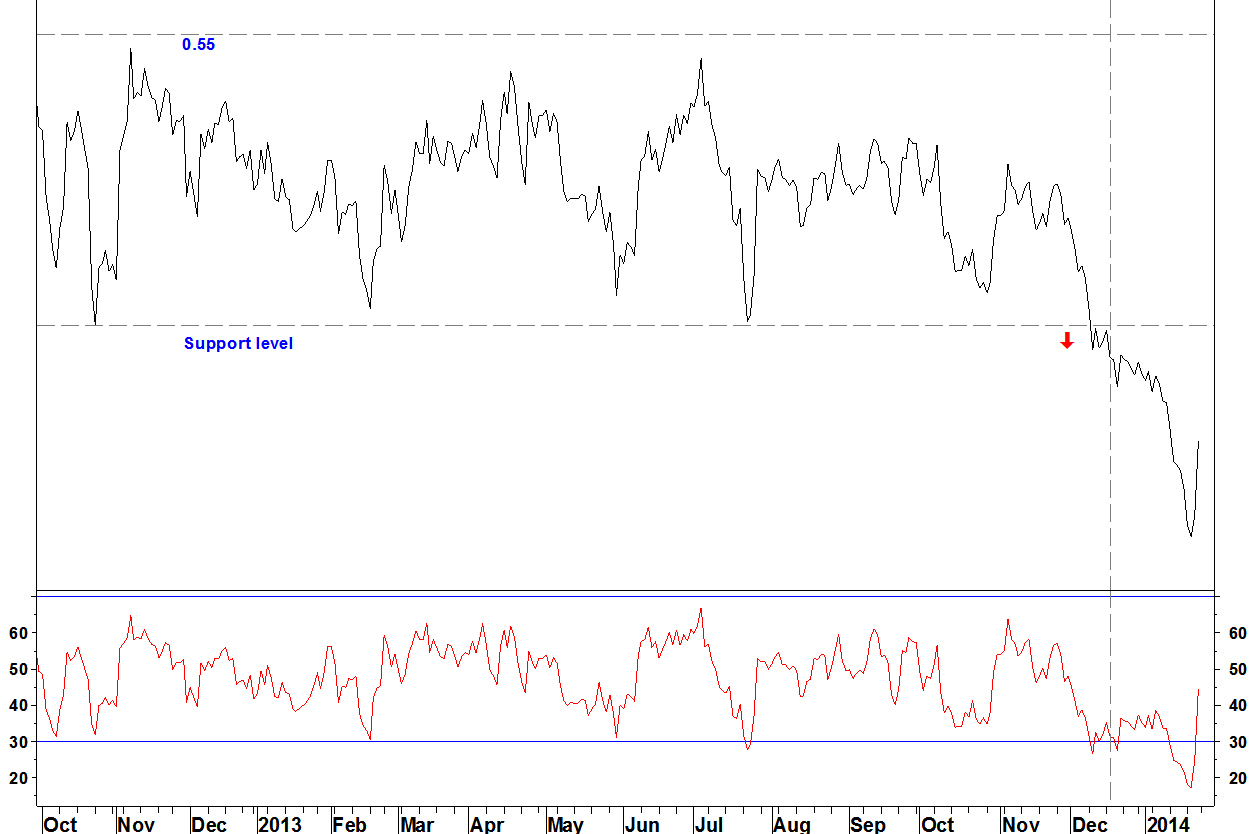
On 04 December, I showed how the S&P 500 Restaurants Index was setting up to move to underperform against the S&P 500 and some sectors. This move looks like it is starting.
S&P 500 Restaurants Index versus S&P 500 Index (weekly)

Having traded sideways for 16 months, the 14 week RSI is not oversold, it is only just starting to move away from mid range
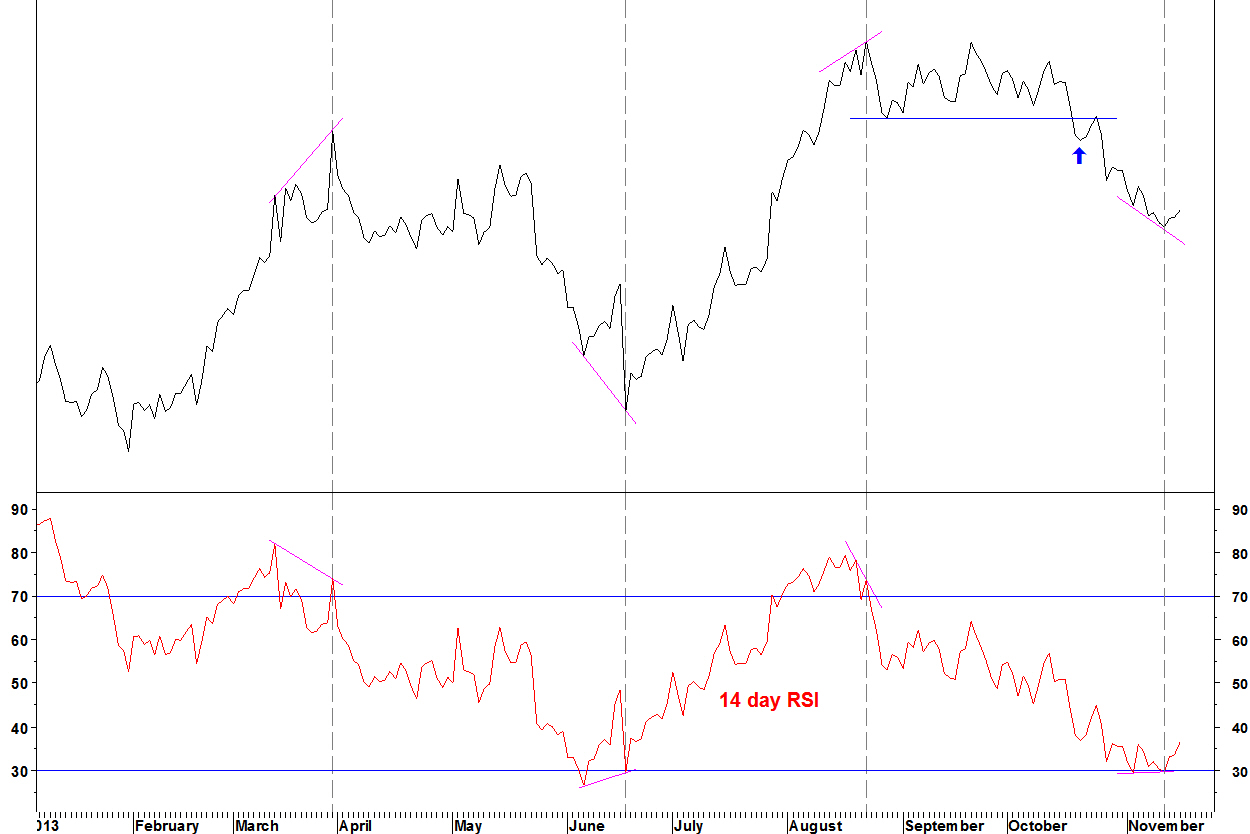
S&P 500 Restaurants Index versus S&P 500 Index (daily)

- Previous moves to the October 2012 support level were quickly reversed
- This time, support broke on 10 December and the break has held
- Given the above, the long term moving average crossover and the 14 week RSI not being oversold, the possible RSI divergence on the daily chart is of less importance
I didn’t find any of the larger cap restaurant stocks (those in the SPDR Consumer Discretionary XLY) setting up exactly as above. I will show the trade as a sector trade even though in practice, it may not be directly tradable.
The trade
- A short position in the S&P 500 Restaurants Index versus the S&P 500 Index is opened
- The sector index closed at 905.59 on 17 December, so the pair is opened at 0.508473
- The stop loss is at first, back above the 16 month range at 0.55, which is 8.2% higher
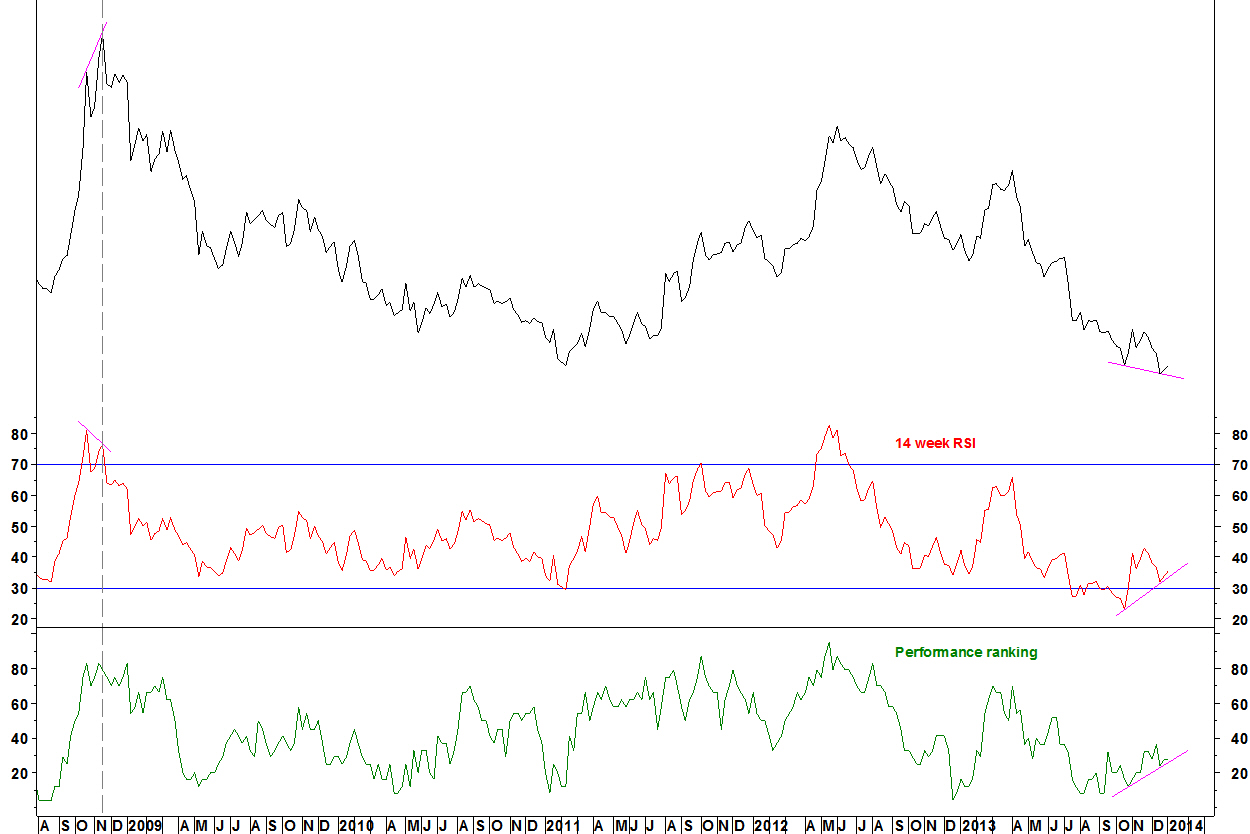
The S&P Restaurants Index has been a long term outperformer. This is set to end, although the timing is not yet clear.
S&P Restaurants Index versus S&P 500 Index
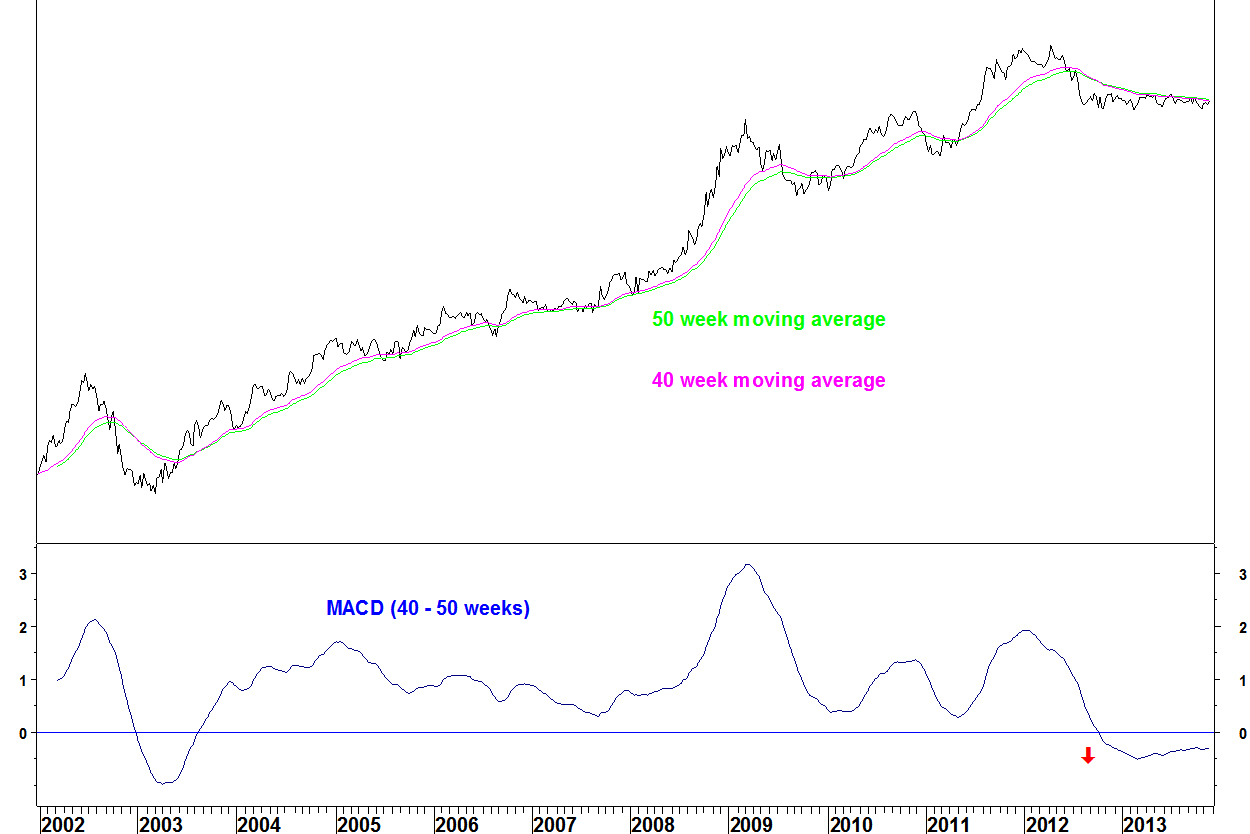
- The 40 and 50 week moving averages crossed in August 2003
- They stayed in bullish alignment until the negative crossover in September 2012
- This comfortably qualifies for my criteria of finding averages that have not crossed for four years, to give a good chance of reversion
Since August 2012, the chart has traded sideways. This is a good example of why long term moving average crossovers show that something has changed but don’t give the timing of the move.
For timing, I would use my Bollinger Band breakout method. I prefer breakouts that occur soon after a tight band contraction, whereas bands that have been contracted for ages are less useful. The band width can always be adjusted to give this but the key is; there should be a track record of that band width giving good signals.
S&P Restaurants Index versus S&P 500 Index (70 week Bollinger Bands)

Here, the 70 week bands have recently contracted but the shorter bands would have dribbled and stayed together. There isn’t a track record for the 70 week bands to examine, so in this case, maybe just going with a decisive support break will have to be the signal.
Sectors against the S&P Restaurants Index
A few sectors set up in a similar way to the S&P 500 Index, they are:
S&P Food & Staples Retailing
S&P Health Care
S&P Financial
Inverting the chart..
S&P Food & Staples Retailing Index versus S&P Restaurants Index

Watch for a break above the range that has been in place since August 2012.
On first look, I didn’t find any of the larger cap restaurant stocks (those in the SPDR Consumer Discretionary XLY) that closely matched the sector chart. This will need another look for good candidate stocks and good stocks for the other side of the pair.
I have shown on many occasions that divergences on the 14 day RSI can be a good reason to remove a position, although they are insufficient to warrant opening a position.
Recently, I opened a short position in Hormel Foods (HRL) v SPDR Consumer Staples (XLP). This showed a bullish divergence on its 14 day RSI on 12 November. The ratio rallied the rest of last week.
The stop loss on this position is moved to break even. Longer term, there was a bearish divergence on the 14 week RSI and Performance Rank, which prompted the short position.
Weekly chart

That long term divergence may still take effect and bring further underperformance of its sector for Hormel Foods, I just don’t want a profitable trade becoming a loss even in the short term, hence the move of the stop loss. If stopped out, the pair could still be shorted on a reassertion down but that may not fit one of my defined trade set ups.
International Flavors & Fragrances (IFF)
On 28 October, I showed the bullish daily divergence on IFF versus SPDR Materials (XLB) and gave it as a reason to take some profit. Well, look what happened since then!
Daily chart

Half of the position has a 4.7% profit and the other half was stopped out at break even.
On Monday, I showed the chart of Hess Corporation (HES) versus SPDR Energy (XLE) with its entry criteria, on the condition that the results announcement would have passed.
The price fell 3.8% on the results announcement yesterday, giving the entry signal that I set out.
Daily chart

There will probably be some sort of short term recovery, possibly for a week or two. As far as my trading record for this blog goes, I will open the short position in the pair at yesterday’s close of 0.92652. The stop loss is above the 21 October high of 0.97054, 4.8% higher. I’ve shown the idea but I can’t micro manage too much.
Today, Owens-Illinois (OI) has an earnings announcement. I don’t like holding positions into earnings, so the short position versus SPDR Materials (XLB) will be closed for a very modest 1.1% profit. It can always be opened again after earnings if the trend resumes, the medium term set up is still in place.
Here is another Performance Ranking (PR) method example, this time using a component of the SPDR Consumer Staples (XLP). These can be found in any sector if you have the list of components of a tradable sector benchmark. There is plenty of scope for using this method.
The chart of Hormel Food Corp (HRL) vs XLP shows a bearish divergence on its 14 week RSI. HRL also has a bearish divergence on the Performance Rank – the rank of its price performance within the components of XLP.
Weekly chart
There was bullish RSI and PR divergence at the August 2012 relative low for HRL (dashed line).
Daily chart

- The chart shows three instances of daily RSI divergences marking turning points
- There was not a perfect match to my RSI divergence criteria at the high but weekly criteria are more important
- After two months, the ratio has broken below a top formation
The next results release for HRL is on 26 November.
Action
A short position in HRL vs XLP will be opened if a new end of day low below the 21 October low (blue arrow) is made. That will be today if early prices hold. The stop loss will be above the 22 August high (last dashed line), 3.2% higher.
