Hormel Food Corp shows bearish divergence in its sector
Here is another Performance Ranking (PR) method example, this time using a component of the SPDR Consumer Staples (XLP). These can be found in any sector if you have the list of components of a tradable sector benchmark. There is plenty of scope for using this method.
The chart of Hormel Food Corp (HRL) vs XLP shows a bearish divergence on its 14 week RSI. HRL also has a bearish divergence on the Performance Rank – the rank of its price performance within the components of XLP.
Weekly chart
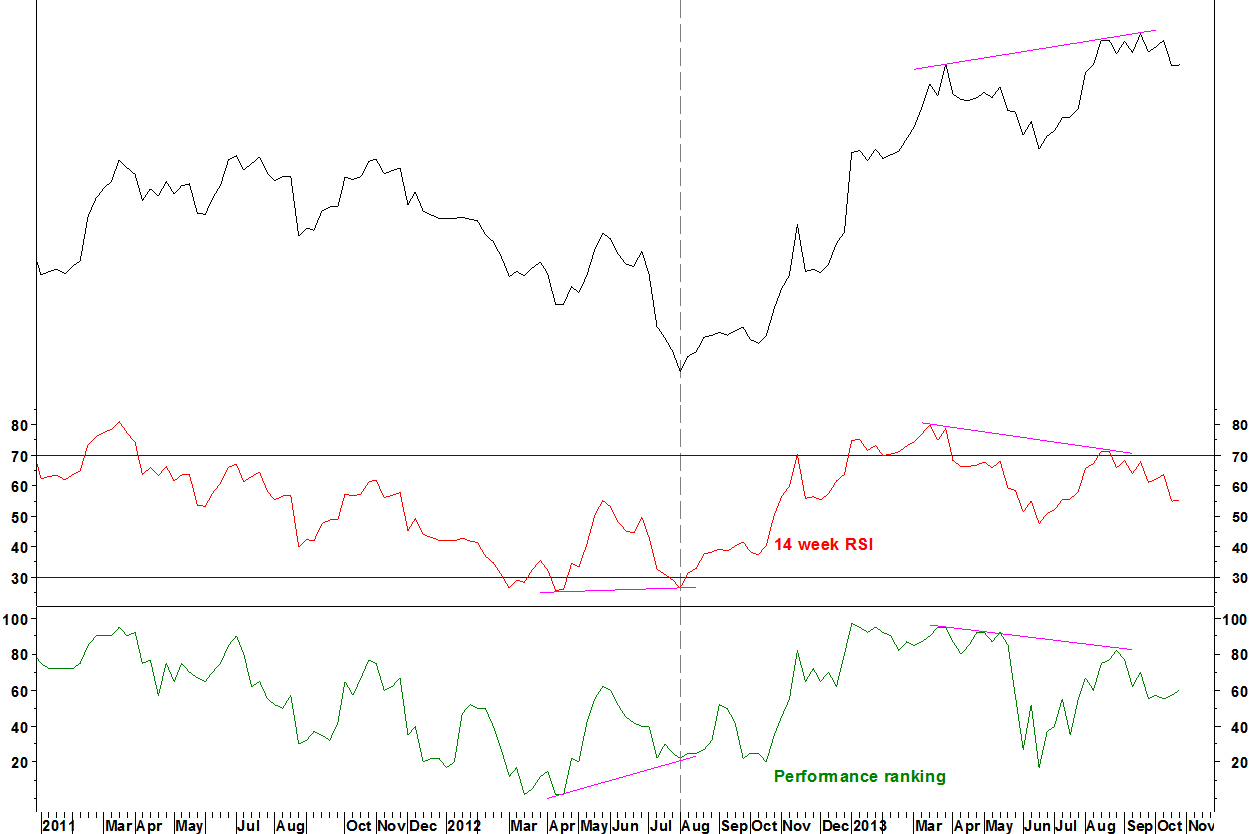
There was bullish RSI and PR divergence at the August 2012 relative low for HRL (dashed line).
Daily chart

- The chart shows three instances of daily RSI divergences marking turning points
- There was not a perfect match to my RSI divergence criteria at the high but weekly criteria are more important
- After two months, the ratio has broken below a top formation
The next results release for HRL is on 26 November.
Action
A short position in HRL vs XLP will be opened if a new end of day low below the 21 October low (blue arrow) is made. That will be today if early prices hold. The stop loss will be above the 22 August high (last dashed line), 3.2% higher.
