A review of the telecom sector
Here, I will review the following factors for the telecom sector:
- Sector against the S&P 500 Index
- Performance of components against the sector
- Sector breadth
In summary
- The telecom sector continues to underperform the S&P 500 Index. There is no momentum divergence for this underperforming trend
- AT&T has underperformed the iShares US Telecom (IYZ). Watch for an end to this underperformance
- There are bearish divergences on two long term breadth indicators for IYZ
- A shorter term breadth indicator became overbought at Christmas and has further to fall
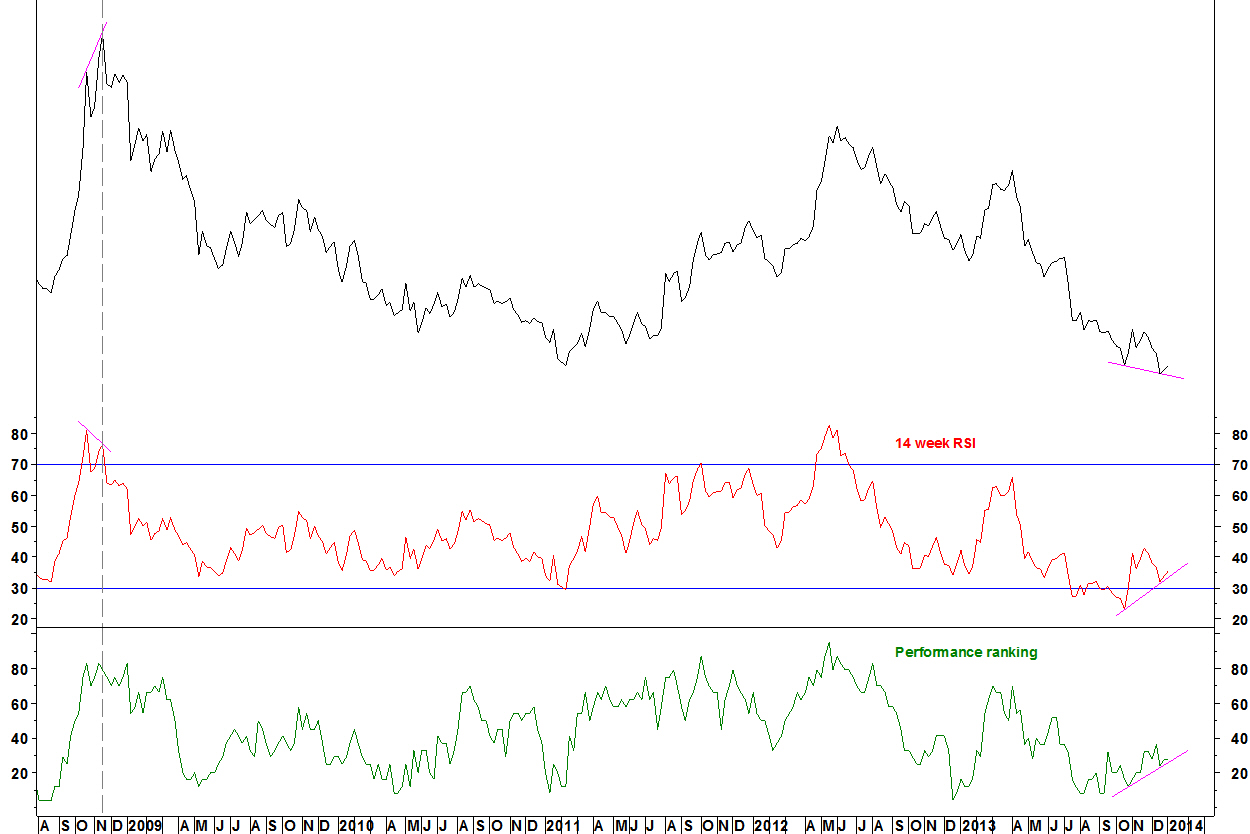
SPX 500 Integrated Telecom Services vs. S&P 500 Index

- The telecom sector has underperformed the S&P 500 Index since August 2012 (point B)
- There is no divergence on the 14 week RSI, which is something to look for as a trend ending indicator
- The Performance Rank (PR) of the sector amongst a range of sectors remains low, with only a slight bullish divergence
In my Performance Ranking method, I rank sector indices by price performance, then look for divergences between relative strength and Performance Rank. I also look for an RSI divergence to back this up.
The telecom sector does not meet my criteria for identifying high probability reversion candidates.
In my ideal criteria, the RSI divergence forms above 70 or below 30. In early 2009, this was not the case but the divergence still worked. Other factors, such as commonality amongst defensive sectors were more important. Exact criteria can always be reviewed and altered.
Performance rank of components of iShares US Telecom (IYZ)
Using my Performance Ranking (PR) method, I also rank sector components and look for divergences. Here is an example from the energy sector
AT&T (T) vs. IYZ
- The relative line made a new low in December, with bullish divergences on the RSI and PR
- Watch for improved relative strength for AT&T against its sector
Breadth for the iShares US Telecom (IYZ)
IYZ and %age of components above 200 day moving average

- Peaks for IYZ came with divergences for the %age of component stocks above their 200 day moving average in 2007 and 2011
- There is now another divergence on this indicator
Caveats
- Not all divergences end up being peaks. Sometimes the divergence is blown away, like in September 2010 and May 2013
- This indicator has been calculated on the current components of IYZ
IYZ and %age of components with 50 day moving average above 200 day average

- This indicator showed bearish divergences at the 2007 and 2011 peaks
- There was a bullish divergence at the 2008/09 low, which took four months to take effect
- There is another bearish divergence on this indicator
IYZ and %age of components above 100 day moving average

- Shorter period moving average breadth often works as a range bound overbought/ oversold indicator
- Since 2011, moves for this breadth indicator to 80% have coincided with or shortly preceded ends of rallies
- Sometimes there is divergence at the peak (B and E), sometimes waiting for breadth to fall below 80% is a good sell signal (C and F)
- On 26 December 2013 (G), breadth reached 80% and fell the next day. This was a profit taking opportunity, confirmed on 02 January
- The last two buying opportunities (late August and mid December) have come with breadth just below 50%. Breadth is now 64%
- The long term breadth divergence might mean that a fall below 50% does not lead to give a good buying point
