Restaurant sector to end long term outperformance
The S&P Restaurants Index has been a long term outperformer. This is set to end, although the timing is not yet clear.
S&P Restaurants Index versus S&P 500 Index
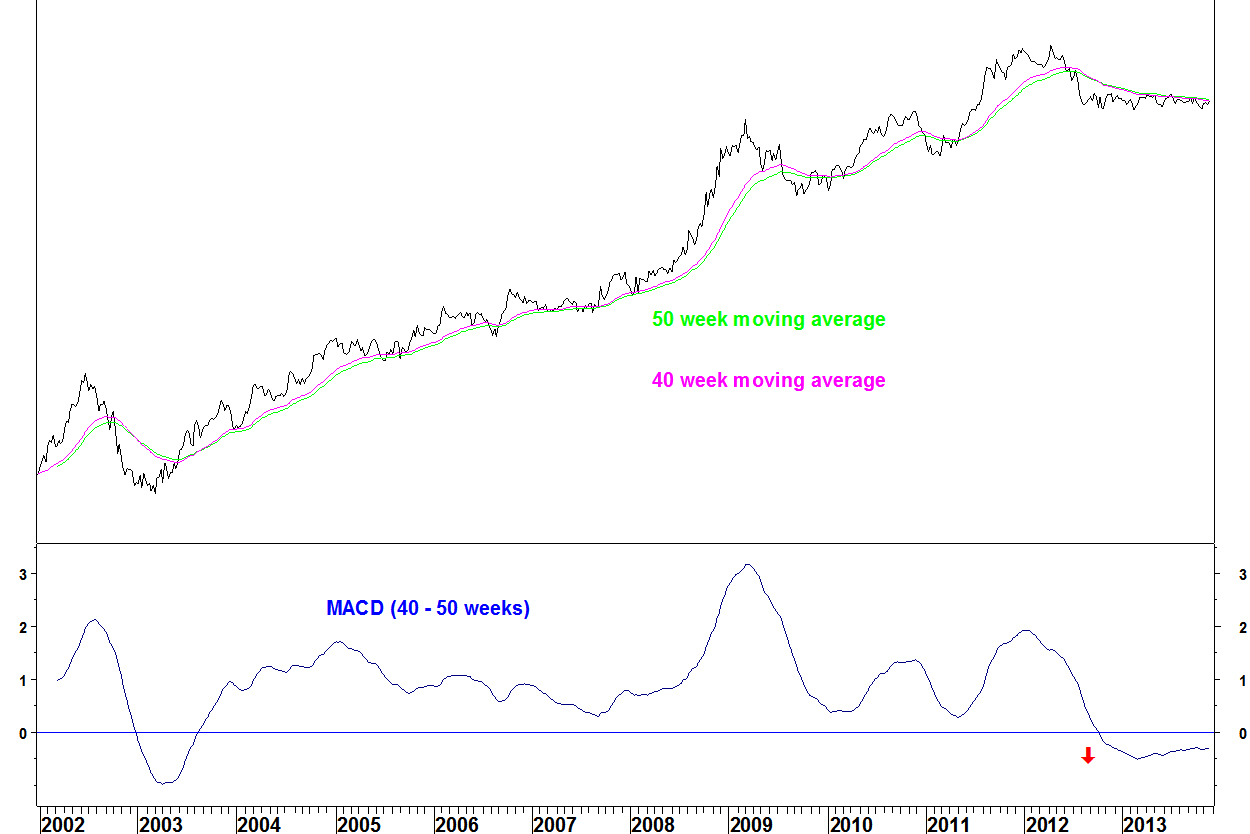
- The 40 and 50 week moving averages crossed in August 2003
- They stayed in bullish alignment until the negative crossover in September 2012
- This comfortably qualifies for my criteria of finding averages that have not crossed for four years, to give a good chance of reversion
Since August 2012, the chart has traded sideways. This is a good example of why long term moving average crossovers show that something has changed but don’t give the timing of the move.
For timing, I would use my Bollinger Band breakout method. I prefer breakouts that occur soon after a tight band contraction, whereas bands that have been contracted for ages are less useful. The band width can always be adjusted to give this but the key is; there should be a track record of that band width giving good signals.
S&P Restaurants Index versus S&P 500 Index (70 week Bollinger Bands)

Here, the 70 week bands have recently contracted but the shorter bands would have dribbled and stayed together. There isn’t a track record for the 70 week bands to examine, so in this case, maybe just going with a decisive support break will have to be the signal.
Sectors against the S&P Restaurants Index
A few sectors set up in a similar way to the S&P 500 Index, they are:
S&P Food & Staples Retailing
S&P Health Care
S&P Financial
Inverting the chart..
S&P Food & Staples Retailing Index versus S&P Restaurants Index

Watch for a break above the range that has been in place since August 2012.
On first look, I didn’t find any of the larger cap restaurant stocks (those in the SPDR Consumer Discretionary XLY) that closely matched the sector chart. This will need another look for good candidate stocks and good stocks for the other side of the pair.
