Hess Corporation shows bearish divergence within its sector
The chart of Hess Corporation (HES) versus SPDR Energy (XLE) has a bearish divergence on its 14 week RSI. The Performance Rank (PR) of HES amongst the components of XLE also has a bearish divergence against its April 2013 high.
Weekly chart
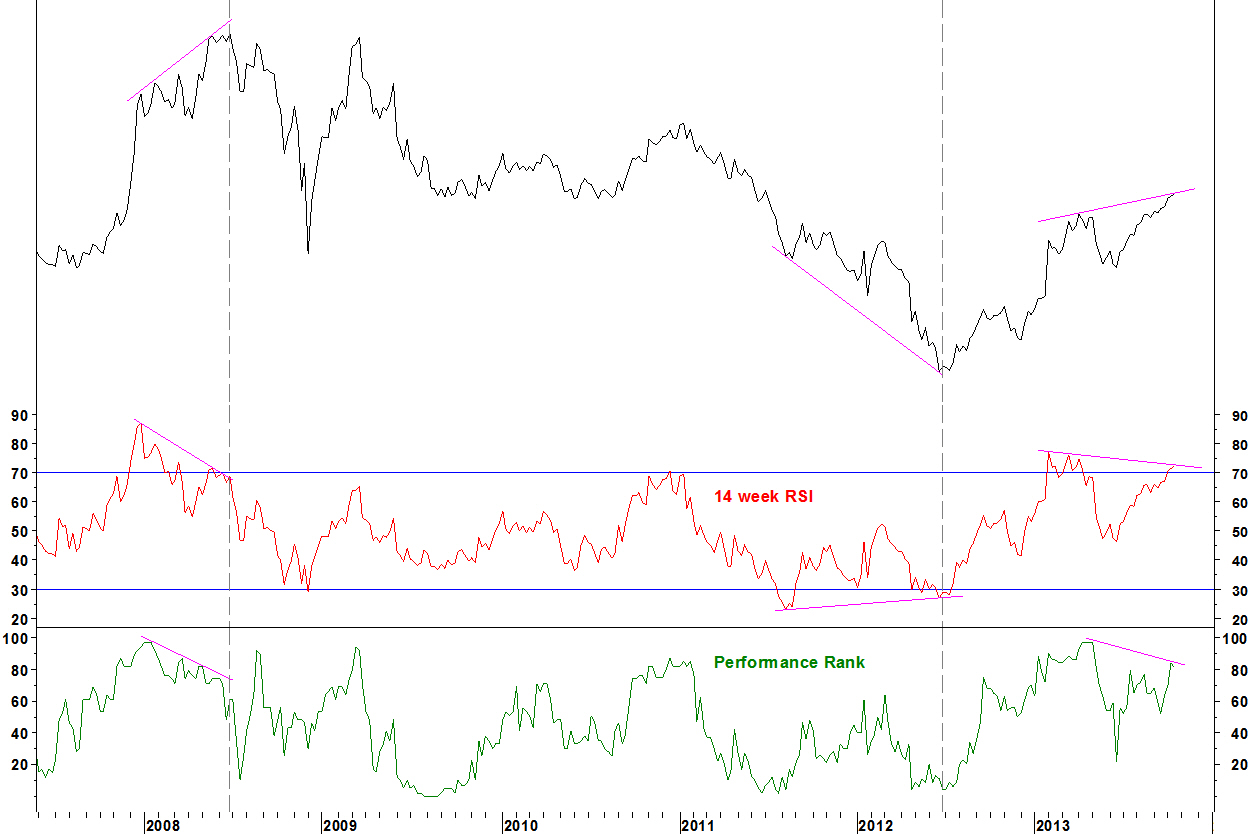
Since 2008, the following set ups have occurred:
- In June 2008, HES v XLE formed bearish divergence on its RSI and PR, then underperformed XLE until December 2008. Crazy times!
- In June 2012, HES v XLE formed a bullish divergence on its RSI at the low. There was no decisive divergence on the PR. A PR divergence can be supporting evidence for the RSI divergence but doesn’t always occur
Daily chart
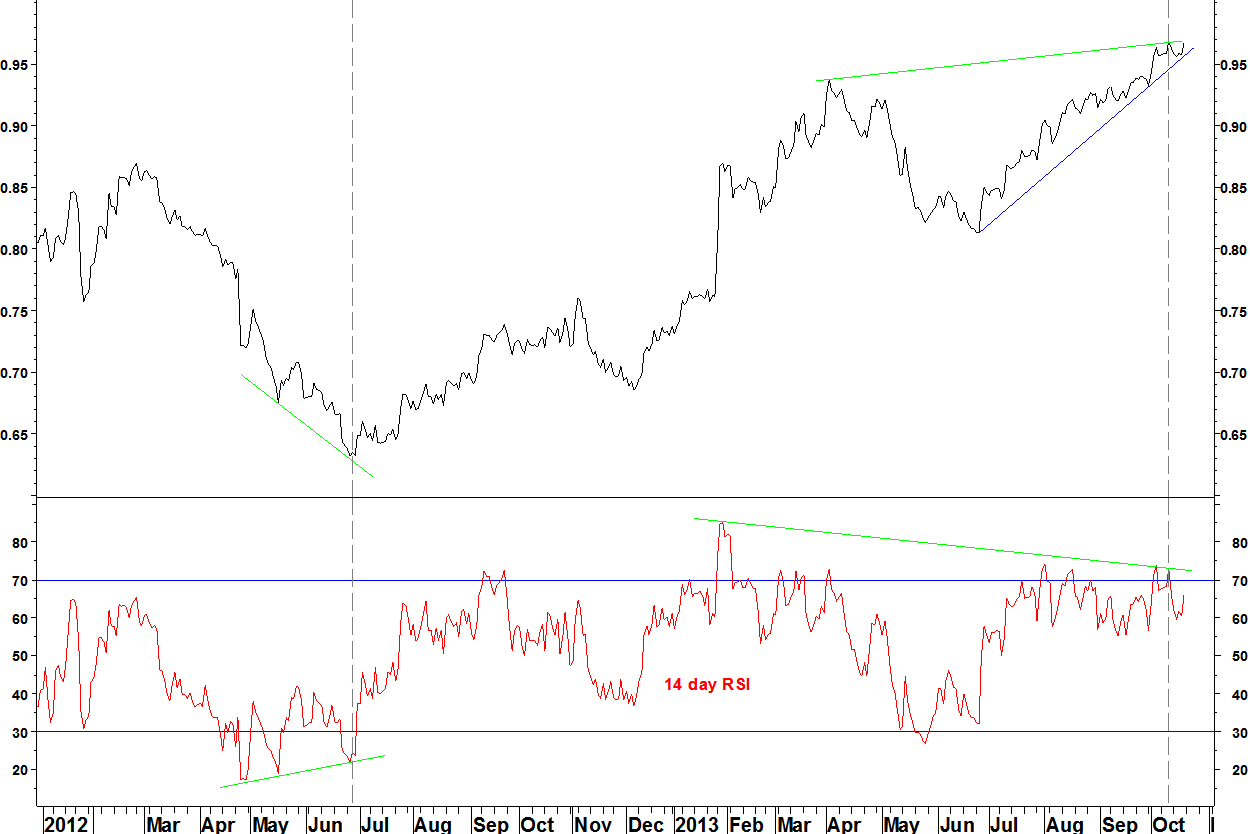
- In June 2012, along with the weekly divergence, there was a daily RSI divergence, although still below 30, not quite matching my ideal daily RSI divergence criteria
- Now, there is divergence on the 14 day RSI against the January 2013 peak. There is fractional divergence against the August 2013 peak
Conclusion
Watch for signs of an end of the outperformance of HES within its sector.
Indications are:
- A move of the weekly RSI below 70
- A break of the trendline on the daily chart
- A move of the daily RSI below the lows since July (55 from 12 September)
A short position in HES v XLE might be opened if these occur. Updates will come via Twitter and on here.

Trackbacks & Pingbacks