Following on from last week, the next example I will show is that of Vornado Realty Trust (VNO). This is an industrial & office REIT and is the 10th largest holding of the iShares U.S. Real Estate (IYR).
Vornado Realty Trust (VNO) v IYR

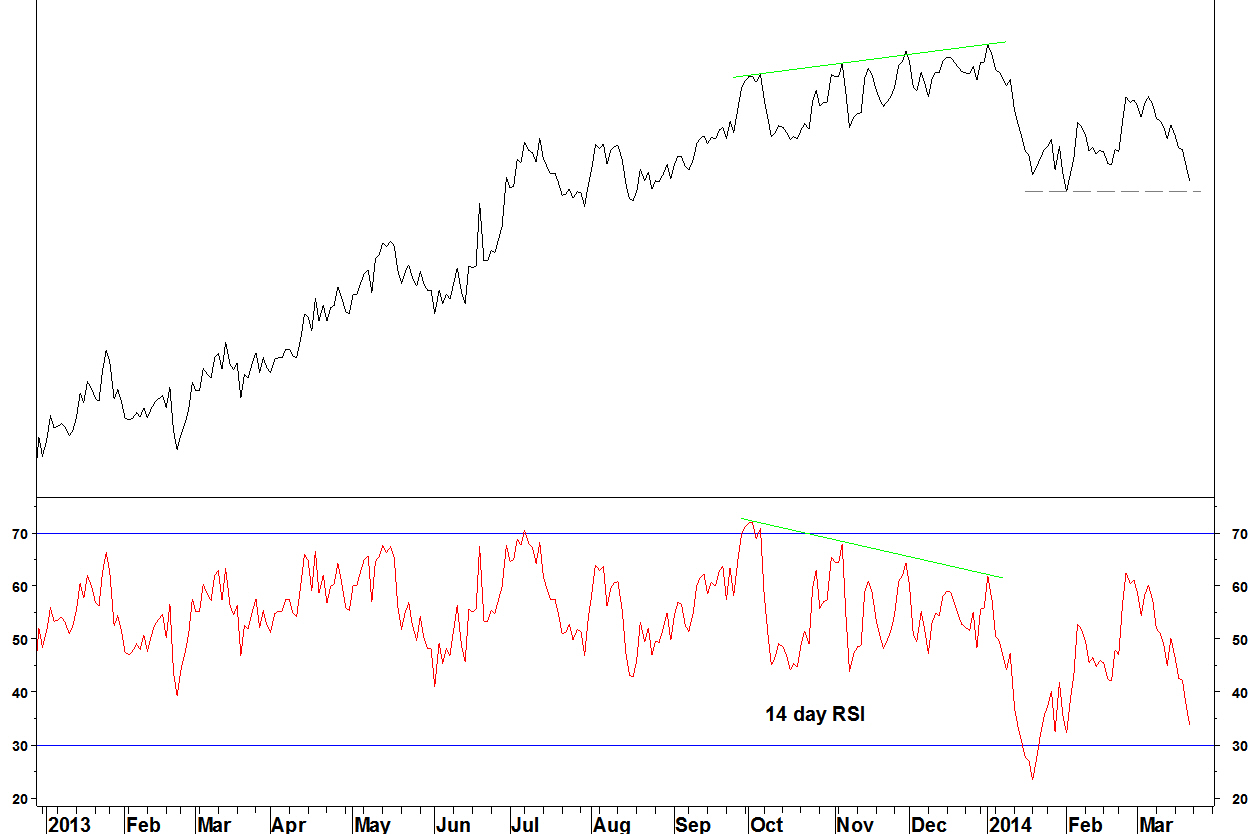
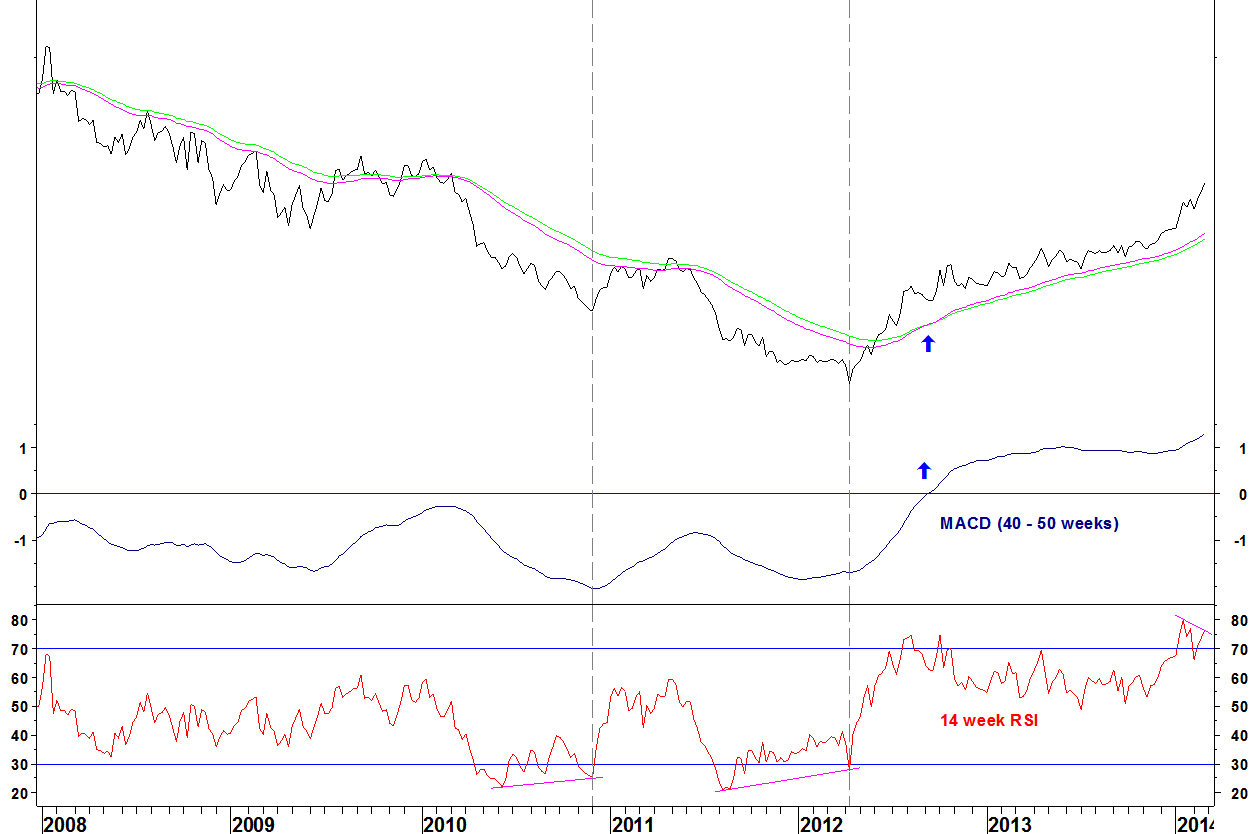
- The 14 week RSI formed bearish divergence at the latest high at the end of May
- There was also bearish divergence on the MACD
Daily chart
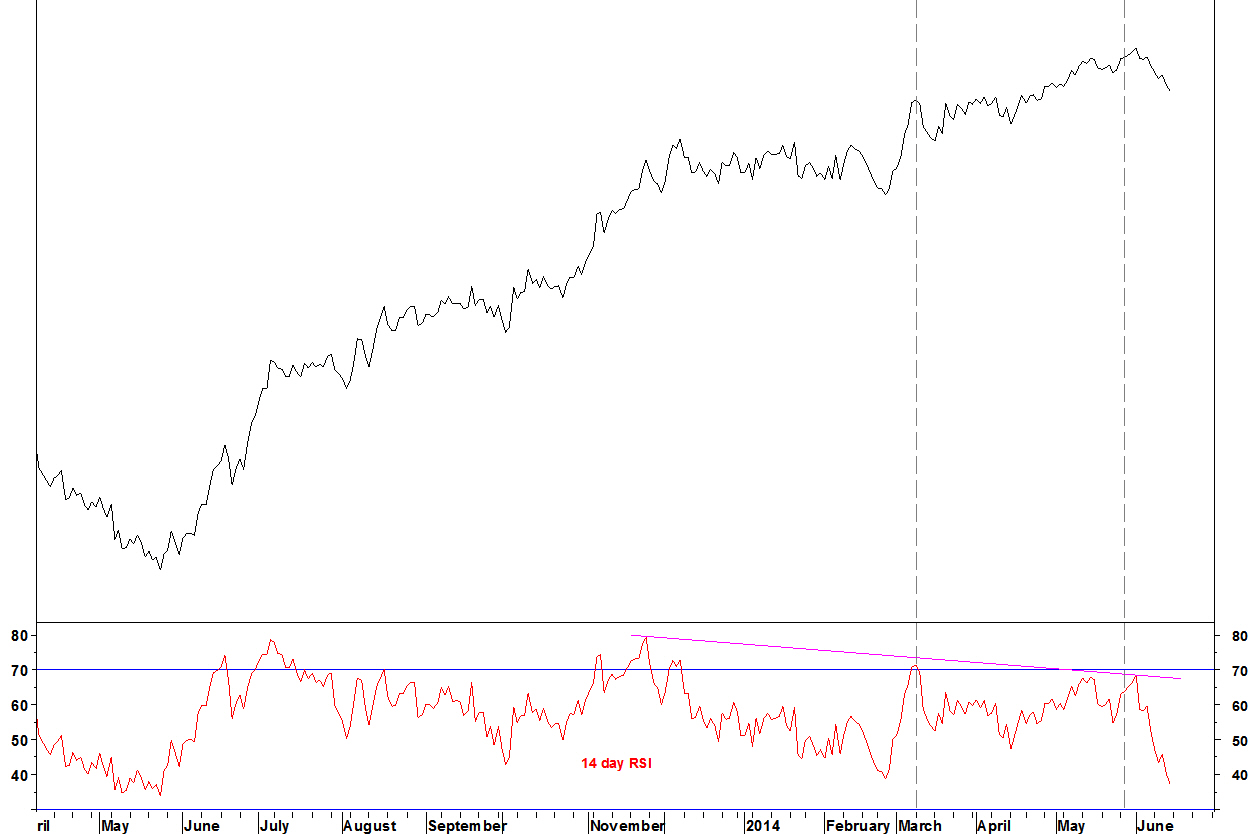
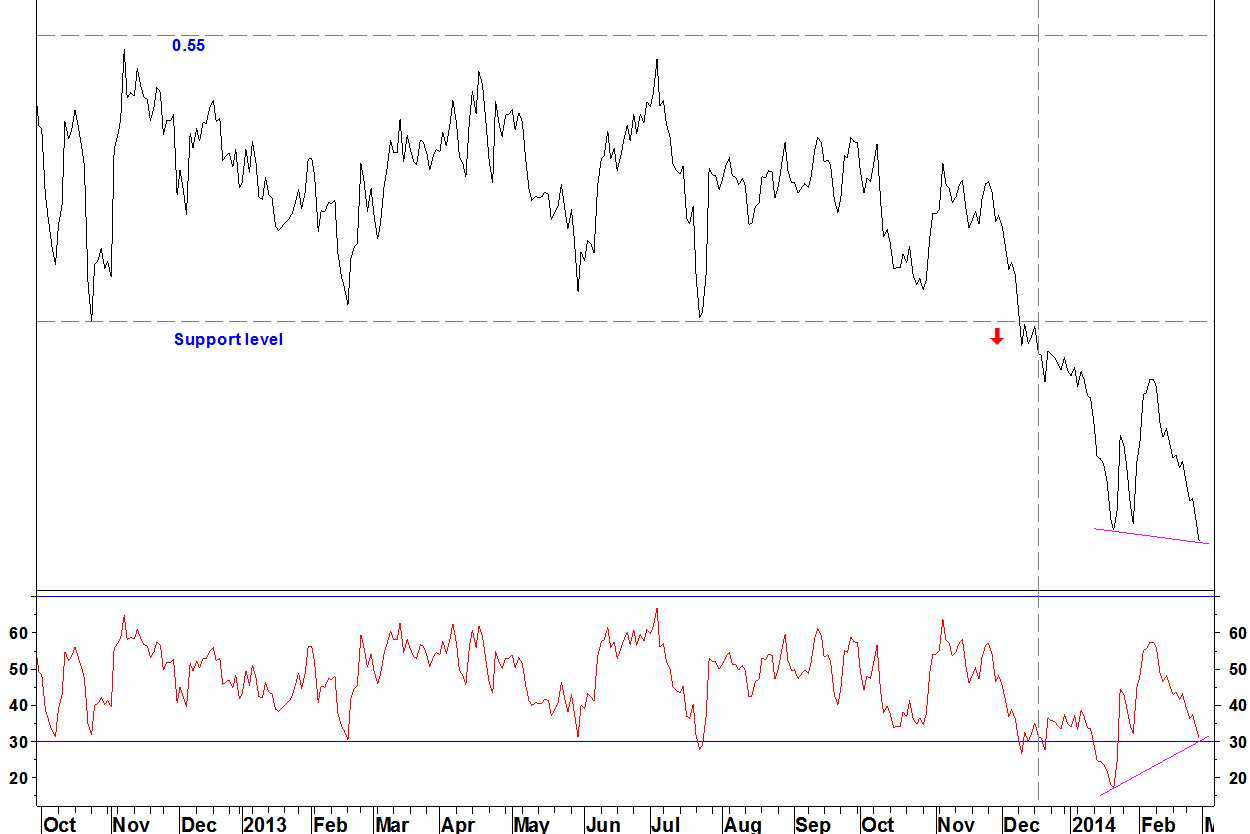
- The 14 day RSI first formed divergence above 70 in March (first dashed line) then another divergence below 70 (second line), coinciding with the weekly divergence
- This meets my ideal RSI divergence criteria
Summary
From the low in May 2013 to the high on 02 June, VNO has outperformed IYR by 29.6%. This year of outperformance is likely over and there could be a significant pull back.
The blog has taken a bit of a back seat with various other things going on. I’m going to show some current examples of my methods using components of the iShares US Real Estate (IYR), starting off with a defensive stock.
Methods shown:
RSI divergences
Long term moving average crossovers
Performance Rank (PR) divergences
Washington Real Estate (WRE) v IYR
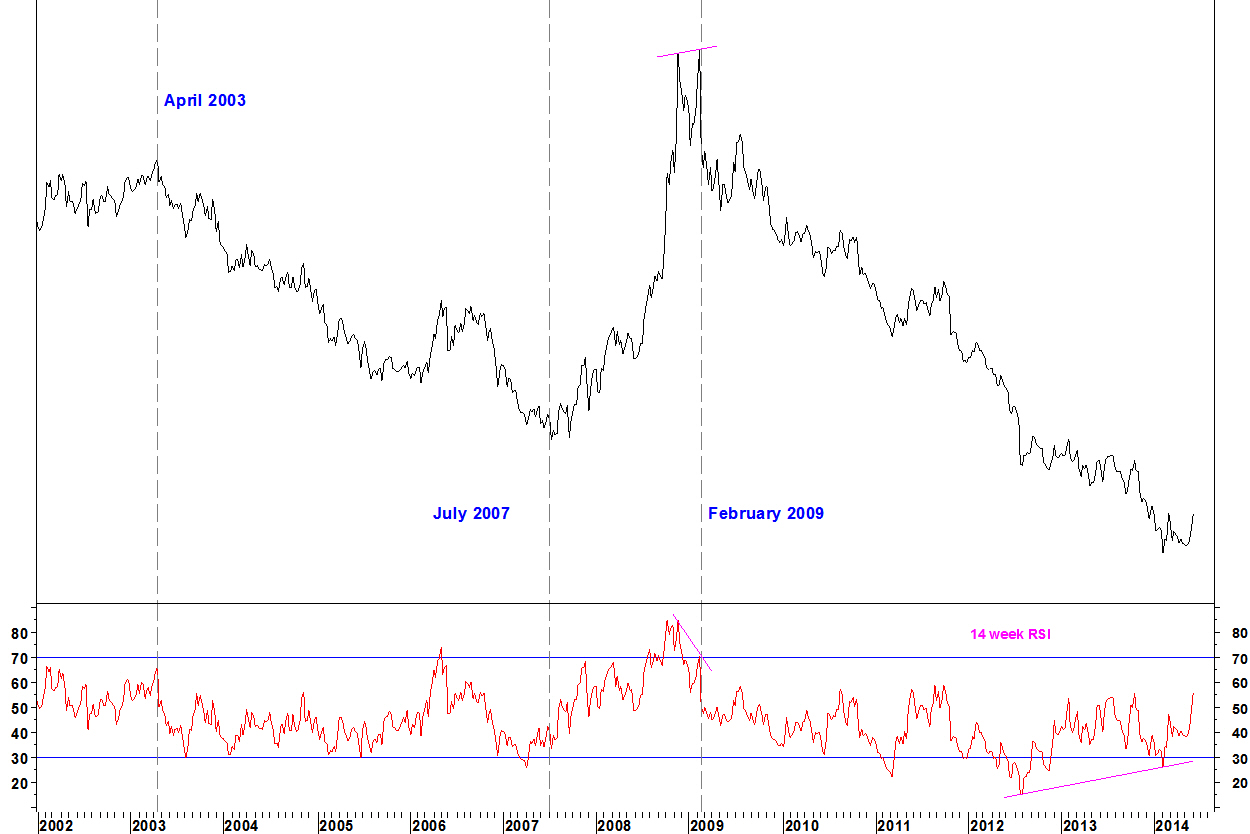
- WRE outperforms IYR in bear markets and underperforms in bull markets
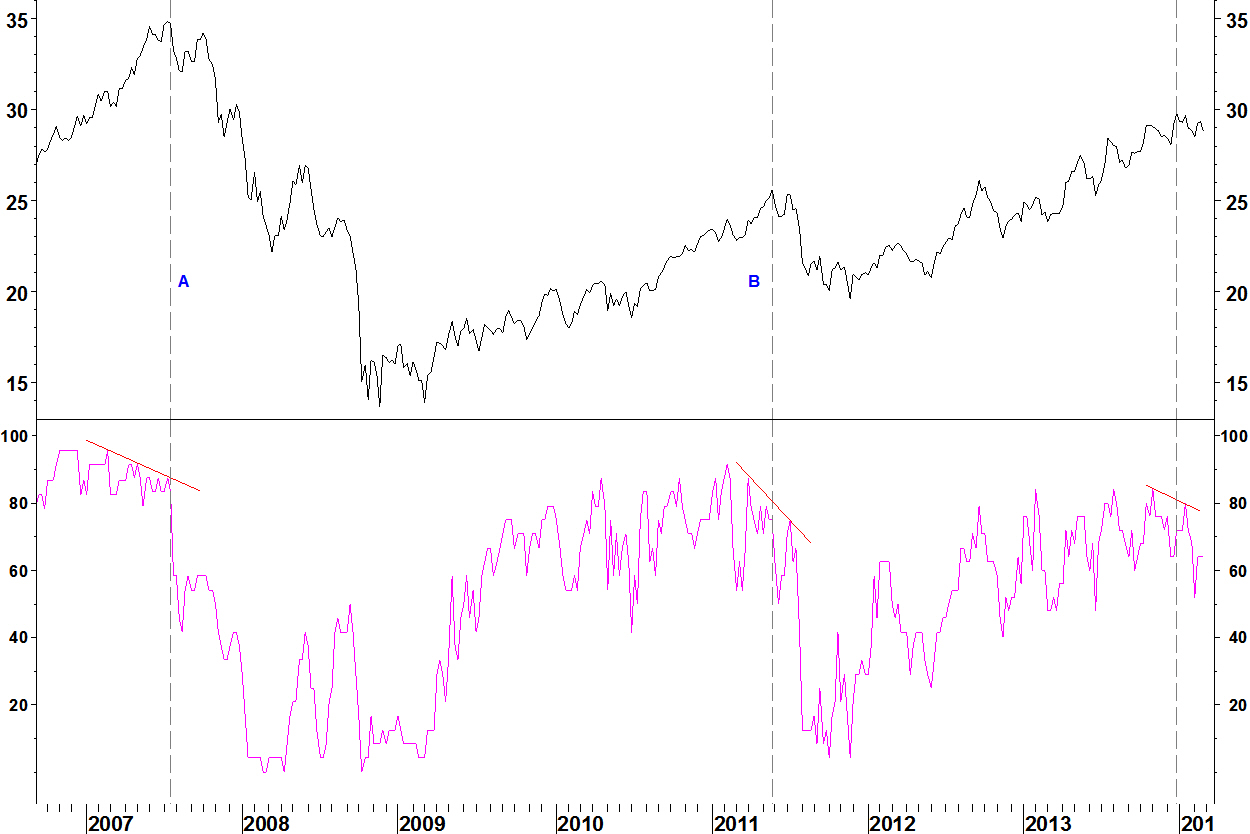
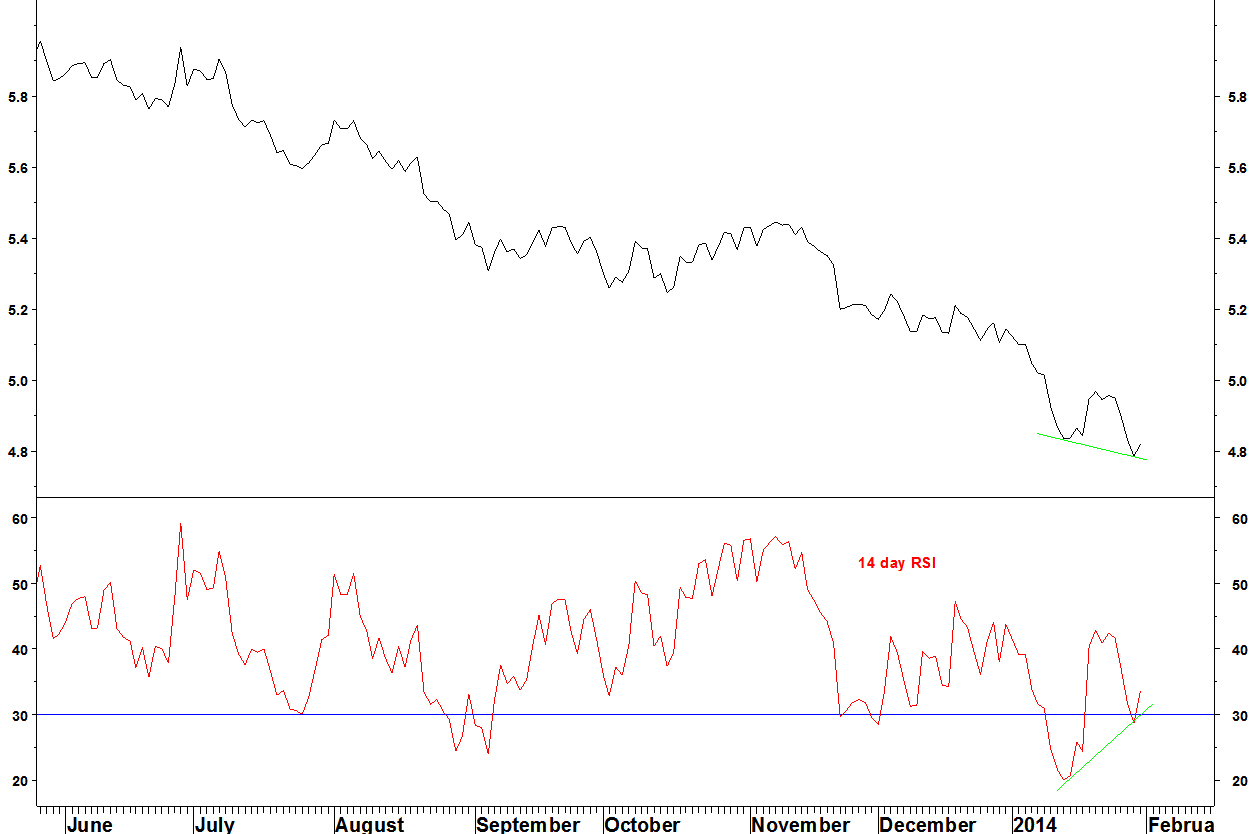
- The relative had a bearish RSI divergence at the high of February 2009
- The late 2012 bullish divergence did not stop the decline (so divergences aren’t flawless) but another RSI divergence formed in February 2014 against the summer 2012 low
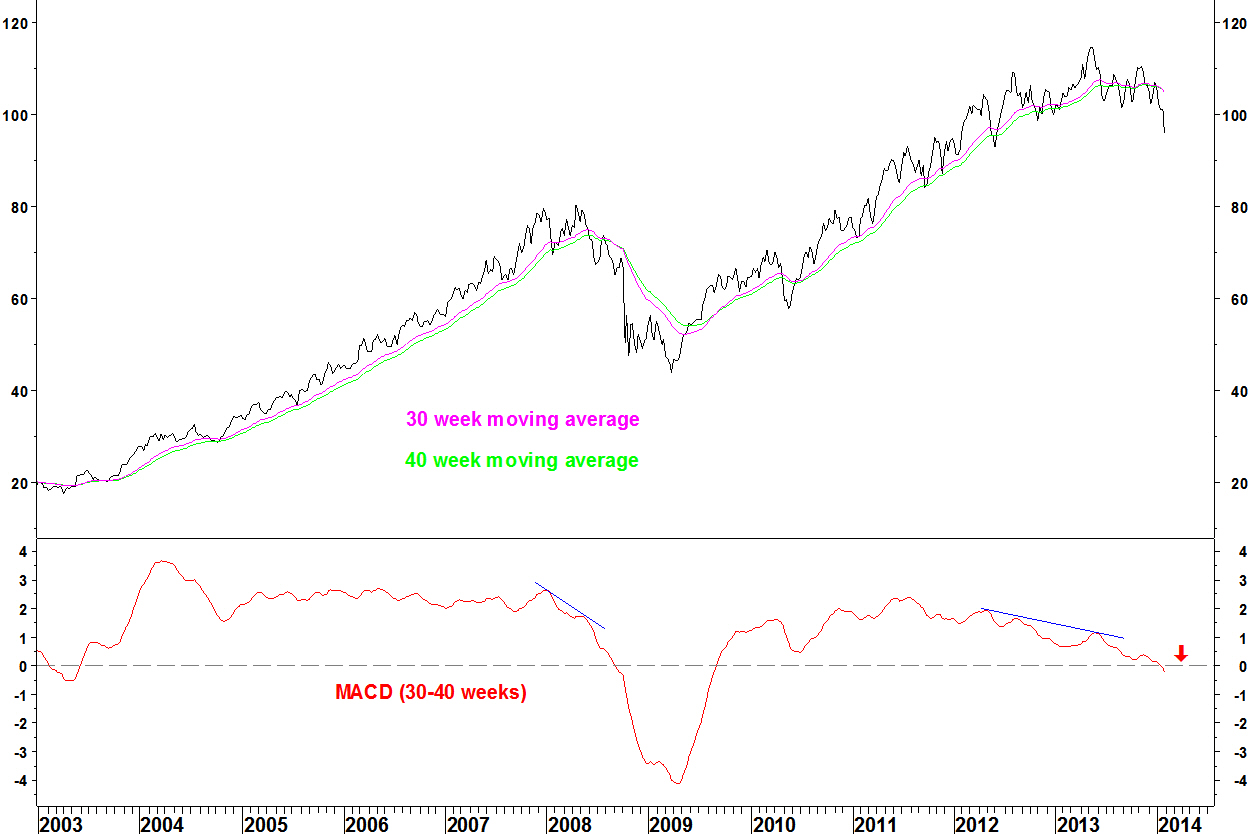
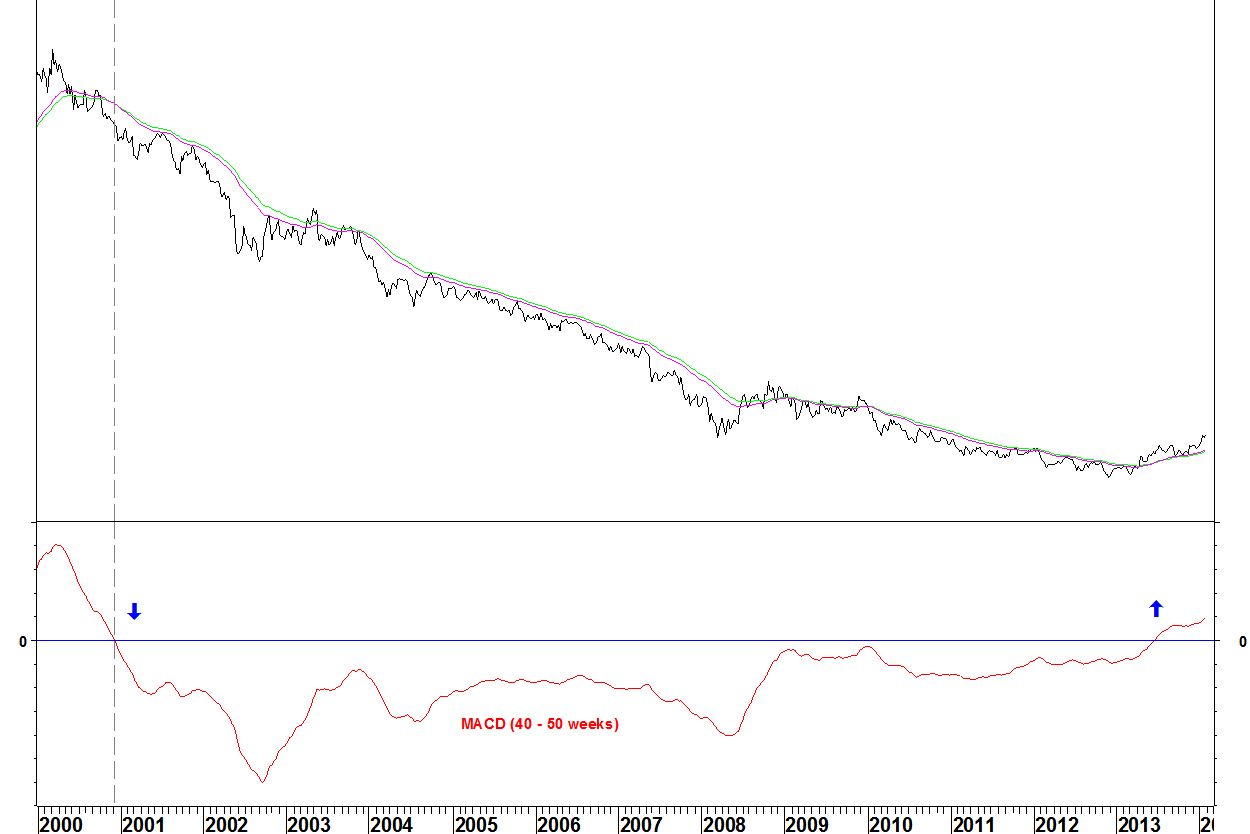
Long term moving average chart: WRE v IYR
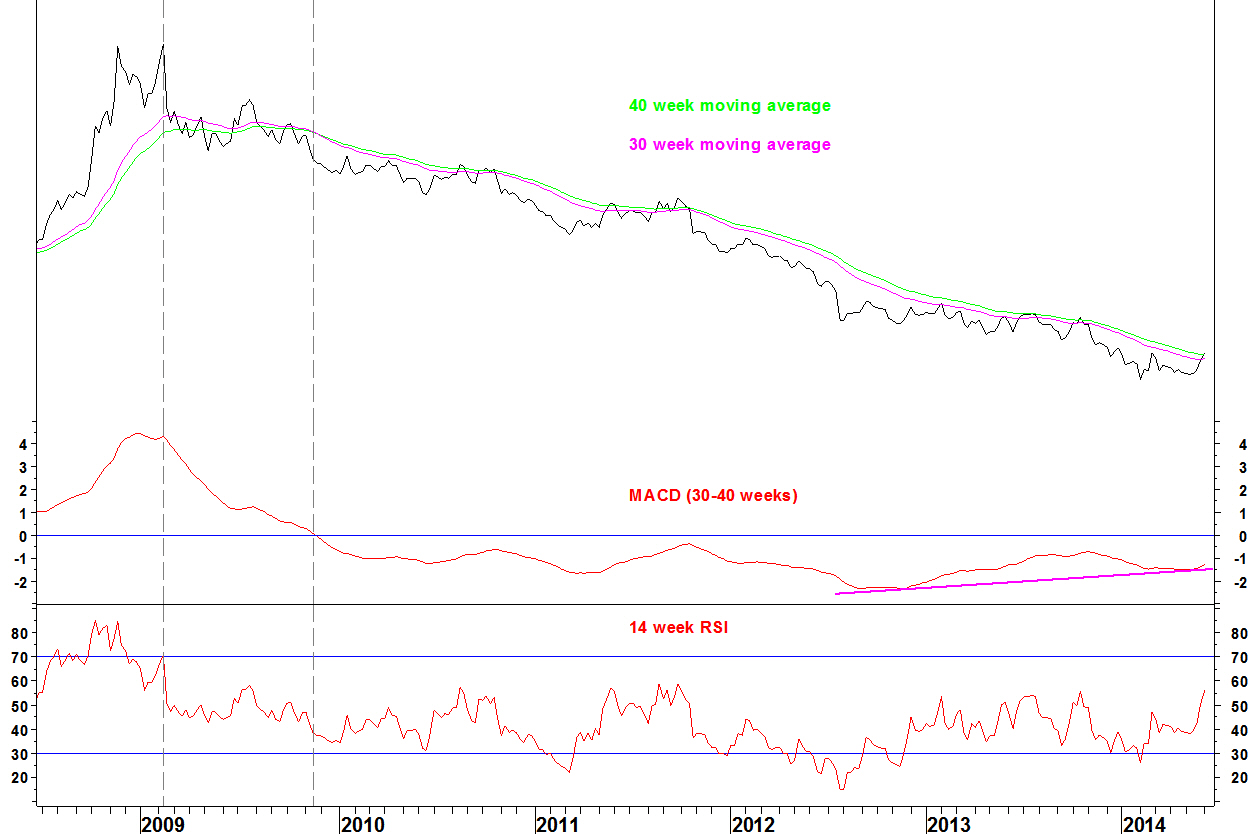
- The 30 and 40 week moving averages have not crossed in over four years
- There is now bullish divergence on the MACD (this is a %age difference MACD, so doesn’t show divergence just because the ratio gets smaller)
Longer term investors in the sector or those looking for clues on the broad market might want to wait for a moving average crossover.
Short term Performance Ranking chart: WRE v IYR
Knowing that the longer term developments are taking shape, shorter term traders could have used the Performance Rank (PR) as confirmation of the short term break higher.

- From 09 April, WRE showed an improving PR (its price performance compared to all other components of IYR), despite the relative low being one month later
- When the relative line moved to a six week high, this was confirmed by the PR moving to a 2014 high. A short term overweight position in WRE in the sector could have been taken
More examples from the US real estate sector will follow in the coming weeks.
The trade in AT&T (T) v iShares U.S. Telecommunications (IYZ) has progressed well since it was opened on 14 March, following bullish divergences on the 14 week RSI and the Performance Rank
The daily chart now shows bearish RSI divergence. This has been updated to include the action as of 5:20pm UK time on Monday 7th April.
Daily chart

With T at $35.68 and IYZ at $29.32, there is a profit of 8.4%.
I will take profit on the entire position, as I will be away twice during April. An alternative tactic would be to take half of the profit now and move the stop loss up to just below the 01 April low.
The stop loss on the position in AT&T (T) versus iShares U.S. Telecommunications (IYZ) is moved to break even. This had been entered following bullish weekly divergences on the RSI and Performance Ranking indicators. At the time of writing, this has a 2.8% profit, having pulled back a bit this week.
The end of week chart shows is below.
AT&T (T) vs. iShares U.S. Telecommunications (IYZ)

The S&P 500 Consumer Discretionary Index has outperformed the S&P 500 Index throughout this bull market. In fact, turns in its relative strength have led the market index since early 2007. There is now the first signs of that outperformance ending.
S&P 500 Consumer Discretionary Index v S&P 500 Index

The sector outperformed until the end of 2013 but with RSI and Performance Rank (PR) divergences having developed since July 2013. The PR is a rank of the price performance over 100 days of a list of US sector indices.
There were also divergences in late 2010 which led to a pause in the uptrend but the current divergences are more pronounced.
Moving average crossover chart
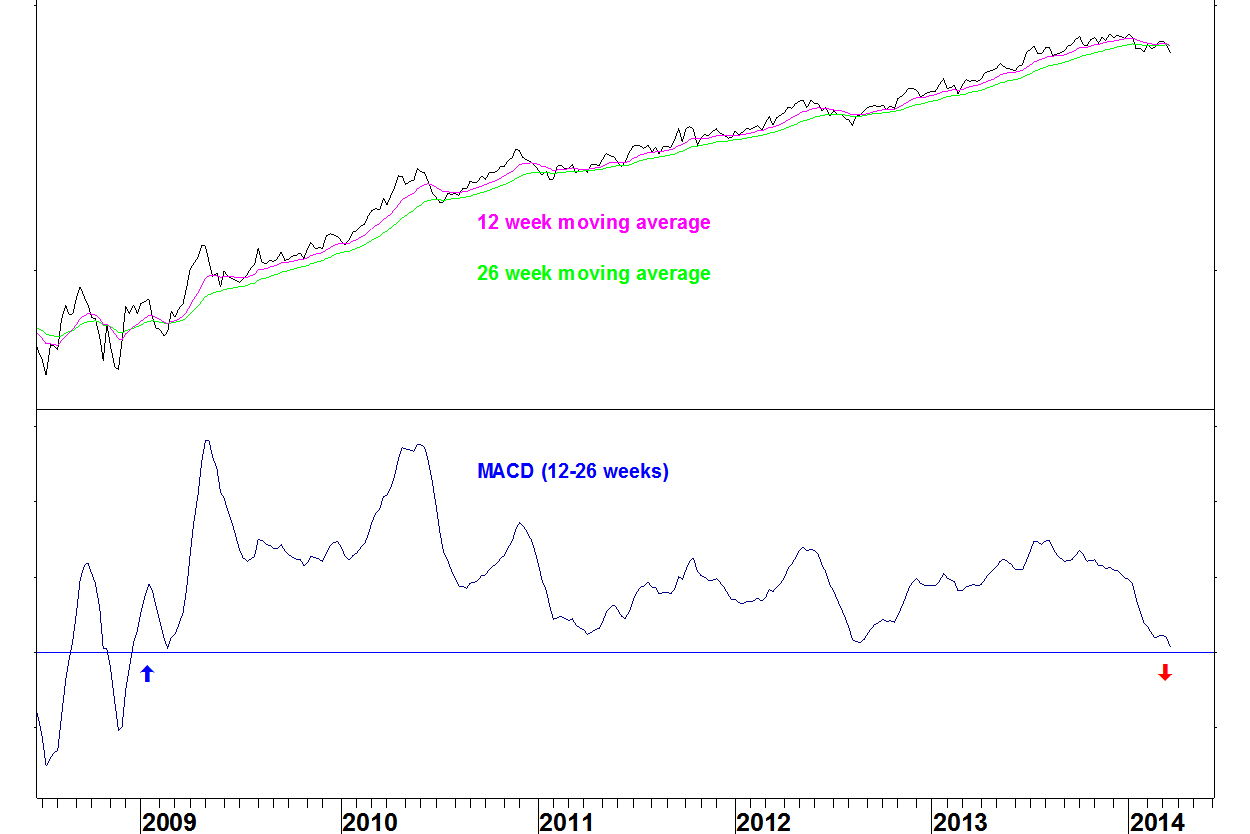
The other difference this time is that the divergences coincide with a pending long term moving average crossover.
- The 12 and 26 week moving averages last had a bullish crossover in December 2008 and have maintained bullish alignment since
- That meets the criteria for MA crossover set ups of at four years since the last cross
- Although there has been a form of divergence since 2010, this is the first divergence within a peak, forming since August 2013
- The crossover is near (when the MACD crosses the zero line), which will be final confirmation
Daily chart
- The high at the start of 2014 came according to my RSI divergence criteria – weekly divergence along with daily divergence that forms first above 70, then below 70
- If the relative breaks the 03 February low (dashed line), it may form a bullish daily RSI divergence
- This could coincide with the long term moving average crossover being confirmed
Summary
The consumer discretionary sector looks set to end its long term outperformance. Just like with the S&P 500 Restaurants sector though, the moving average crossover signal is not a good timing tool, just a long term indicator. Wait for any daily RSI divergence to unwind before opening a relative short position in this sector.
I’ll keep monitoring these charts and providing updates.
At the start of March, I gave the entry conditions for buying the pair AT&T (T) v iShares U.S. Telecommunications (IYZ). These conditions have now been met.
T v IYZ

On Friday, the 14 week RSI closed above 30. Also, the Performance Ranking (PR) of AT&T against the components of IYZ has improved, forming a bullish divergence. This method was outlined with the example using the energy sector.
Daily chart

There is a bullish divergence, initially with RSI below 30 on 25 February but at the final low on 04 March, with RSI above 30. This fits my RSI divergence criteria.
The pair is opened at Friday’s close of 1.12306. The stop loss is a new low, below the 04 March low of 1.09428, so quite a near stop loss, only 2.6% lower.
A short position in the S&P Restaurants Index versus S&P 500 Index was opened in mid December which has progressed well. Now, this trade is near to showing bullish weekly and daily RSI divergences.
Daily chart
There is likely much more downside for this chart in the long term, given the long term moving average crossover. However, daily RSI divergences have been shown to be good profit taking opportunities. It depends on your trading style, with long term asset allocators maybe holding onto an underweight position.
I will take profit on this trade for a gain of 4.5%, I can always re-enter the position later.
S&P Health Index versus S&P Restaurants Index
- The 14 week RSI has bearish divergence
- The ratio could pull back to the moving averages (40 and 50 week), even go below them without negating the long term rotation
- This could easily take several months, look at the scale – would you want to sit through this pullback (in which restaurants outperform health) for months?
At the start of 2014, I gave an outlook for the telecom sector and I will update that here.
SPX 500 Integrated Telecom Services vs. S&P 500 Index

In January, there was no RSI or Performance Ranking (PR) divergence, so no reason to look for a low. Now there is bullish RSI divergence but there would be a better case for a low if the PR had bullish divergence also.
Sector breadth
Breadth for the iShares US Telecom (IYZ) had a divergence in January. No new price nor breadth high has been made since on either the 200 day moving average breadth or the 50-200 day moving average crossover breadth.
IYZ and % above 200 day moving average
The 100 day moving average breadth peaked at 80% at Christmas. I stated that the long term breadth divergence meant that a move back below 50% may not lead to a good buying point. The test of price resistance failed, so this is true so far.
IYZ and % above 100 day moving average

T v IYZ
I showed AT&T (T) v IYZ with a form of RSI divergence, backed up by PR divergence. Now, there is a more ideal divergence, with RSI below 30 and a more pronounced PR divergence (so the sector is ranked slightly better on price performance).
T v IYZ weekly

Also, there is bullish divergence on the 14 day RSI.
T v IYZ daily

Trade set up
In my RSI divergence trade set up, I ideally look for a move above the intervening weekly RSI high. I have increasingly found this to be too far away (42.9 from 22 November in this case). A weekly reversal bar can be used, I must also state this requires a weekly RSI move back above 30.
I will open a long position in T v IYZ on a Friday close of the 14 week RSI above 30. The stop loss is at a new low for the relative line.
One of my methods that I haven’t shown in a while is to look at breadth indicators and in particular, market wide breadth indicators. Breadth usually peaks before the indices peak, with a small number of large cap, fashionable stocks holding up the indices at the end of the bull market.
I’m going to apply that idea to a growing interest of mine – affordability of housing. It is probably the biggest disgrace of our country that young adults cannot afford to buy whilst homes sit empty and older adults block the building of new homes.
The latest Land Registry survey shows that prices continue to rise but take a look at the detail.
- P4 – The England and Wales annual change has been below London since 2008, was negative for over a year and almost flat for another year
- P5 – London has the highest annual increase, other areas with large populations are basically flat
- P6 – Huge swathes of the country (yellow and light green) show minimal increases
- P11 – 12 London boroughs had annual increases above 10%, nine of these were in the top 11 boroughs by price. The highest increases were focused on the most expensive boroughs
- P13 – A small number of properties sell for the highest prices, yet attract huge media attention
Contrast this with 1993 – 2007 when prices rose nationwide. Weak breadth in the stock market – a small number of large, fashionable stocks holding up the market indices is a precursor to a bear market. I think it will be just the same in housing and probably in the next two years.
Last week, British American Tobacco (UK: BATS, US: BTI) broke support and gave the first moving average crossover on the 30 and 40 week averages since September 2009.
BATS price
This confirms the long term change that I had been expecting but support breaks and long term crossovers don’t give well timed trading entries.
I have discussed how daily RSI divergences aren’t sufficient for entering positions but can be used for profit taking and to hold off entries. Now, BTI shows a bullish divergence against the iShares United Kingdom (EWU).
BTI v EWU
I showed how GlaxoSmithKline (GSK) v BTI formed a long term moving average crossover and this pair has rallied.
GSK v BTI long term
There is plenty more scope for this pair to rally in the long term.
GSK v BTI daily chart
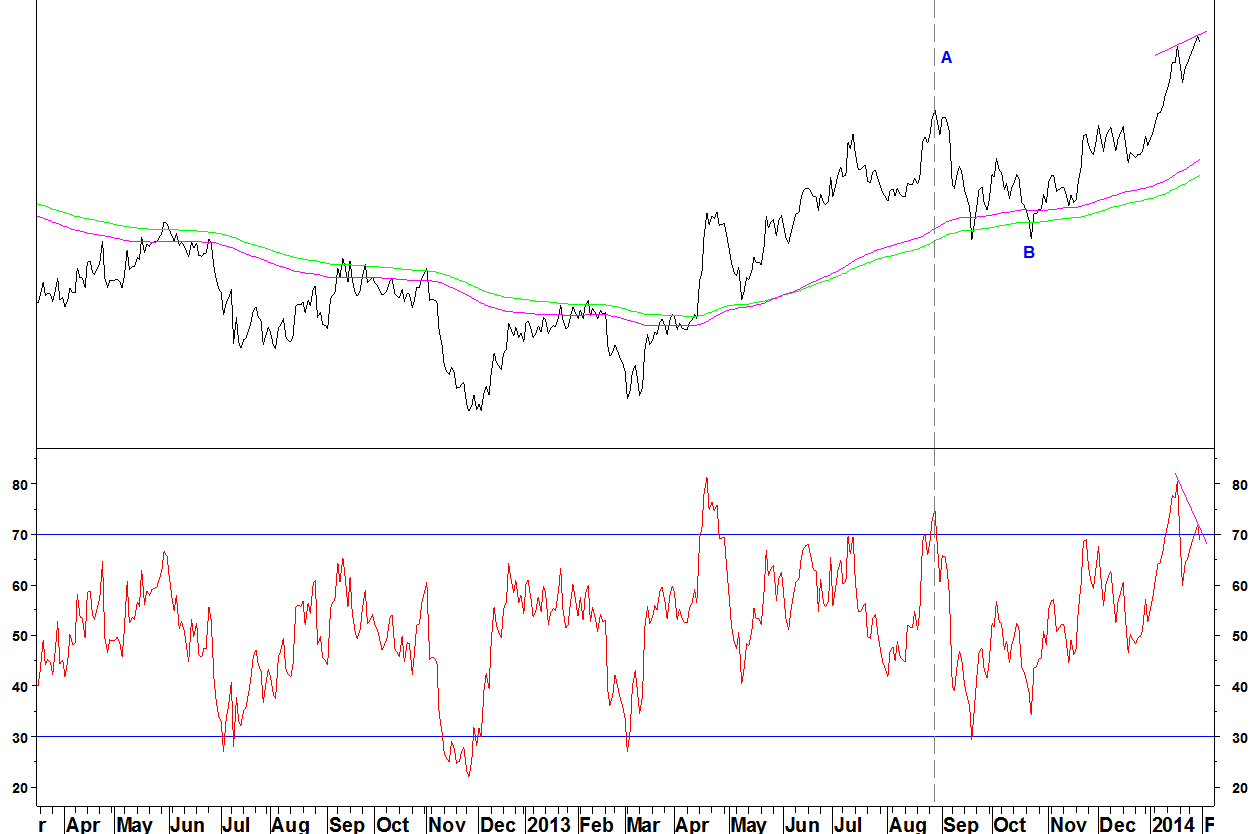
- On the daily chart, the pair has bearish RSI divergence
- In late August at A, the ratio and RSI peaked and it was eight weeks before the rally resumed at B
- The divergence is a better set up that A and the same could happen now – a multi week pull back towards rising moving averages
- That isn’t a good enough reason to short the pair, just to delay making a portfolio weighting switch
- When there is such a long term crossover daily divergences can be blown away but it would be unlikely that the pair leaves this level behind forever and continues higher
