British American Tobacco gives long term price signal but that doesn’t help timing
Last week, British American Tobacco (UK: BATS, US: BTI) broke support and gave the first moving average crossover on the 30 and 40 week averages since September 2009.
BATS price
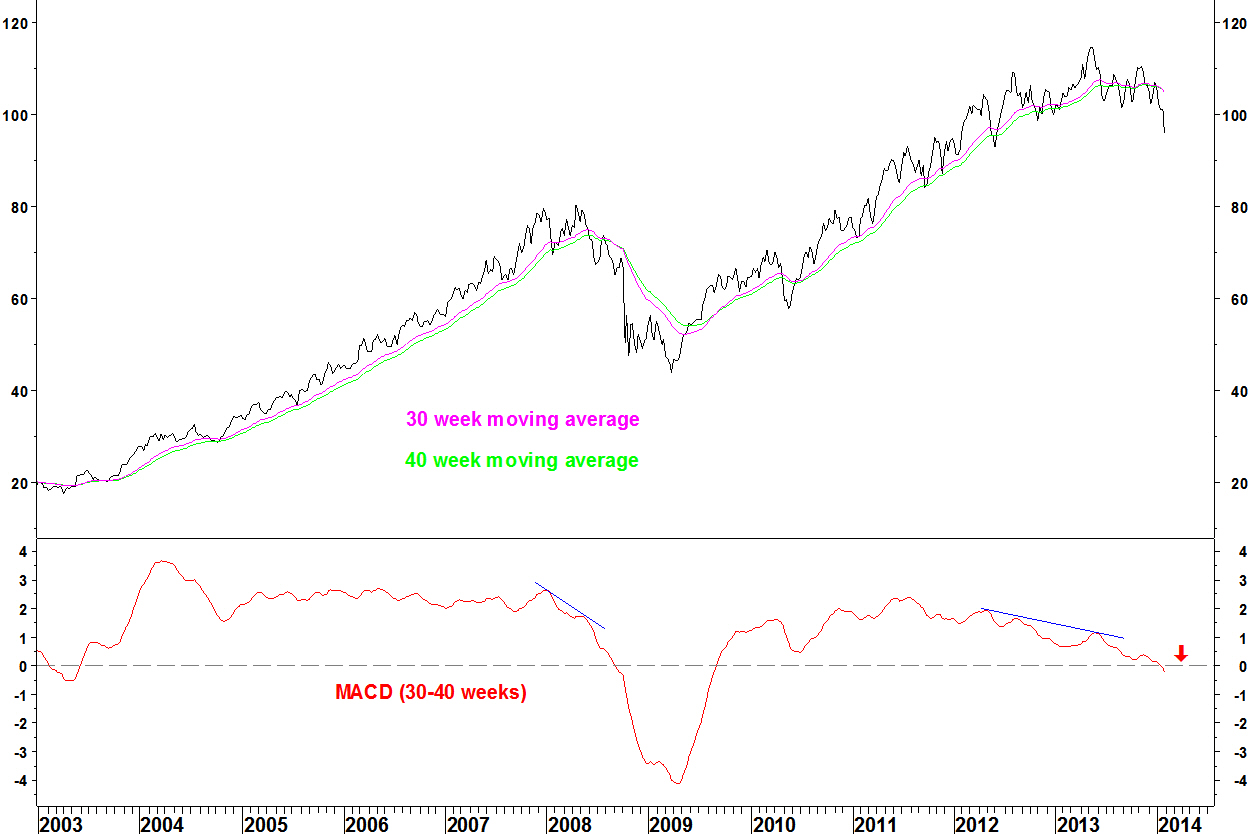
This confirms the long term change that I had been expecting but support breaks and long term crossovers don’t give well timed trading entries.
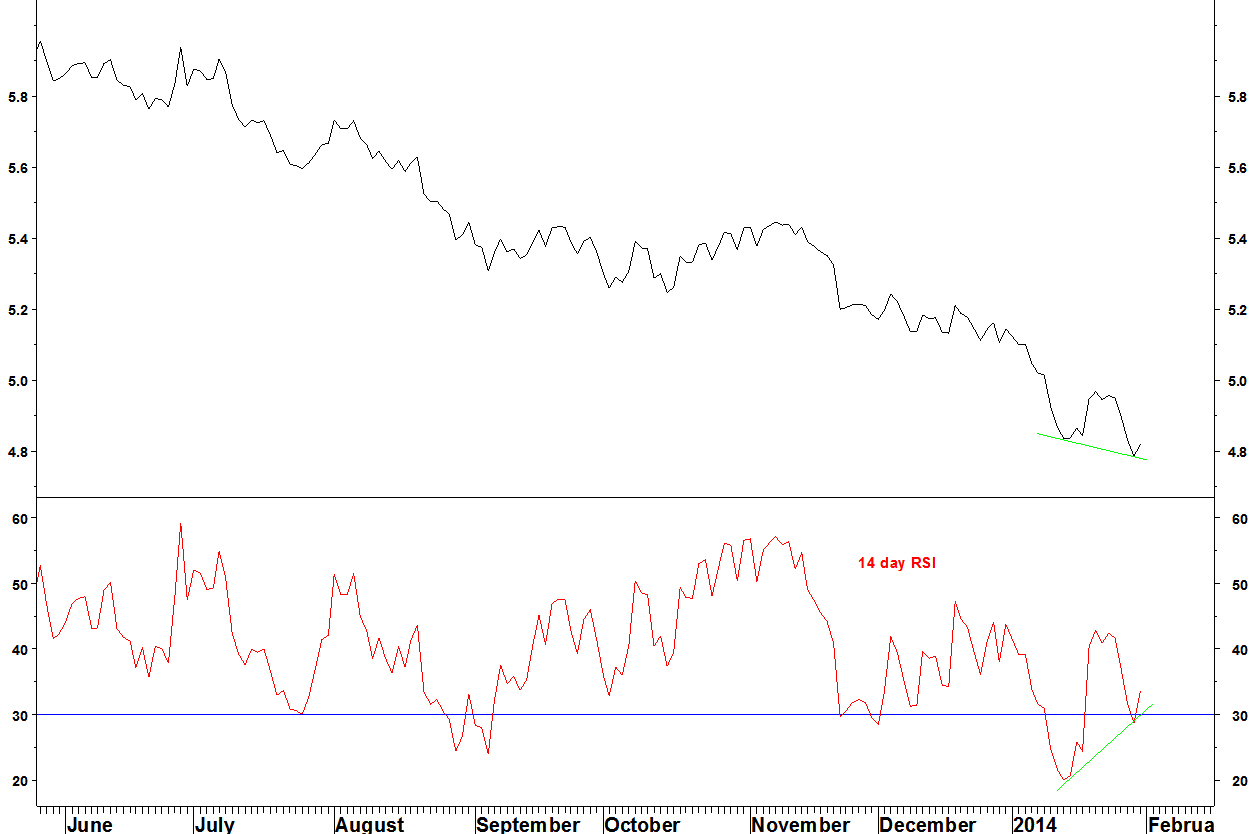
I have discussed how daily RSI divergences aren’t sufficient for entering positions but can be used for profit taking and to hold off entries. Now, BTI shows a bullish divergence against the iShares United Kingdom (EWU).
BTI v EWU
I showed how GlaxoSmithKline (GSK) v BTI formed a long term moving average crossover and this pair has rallied.
GSK v BTI long term
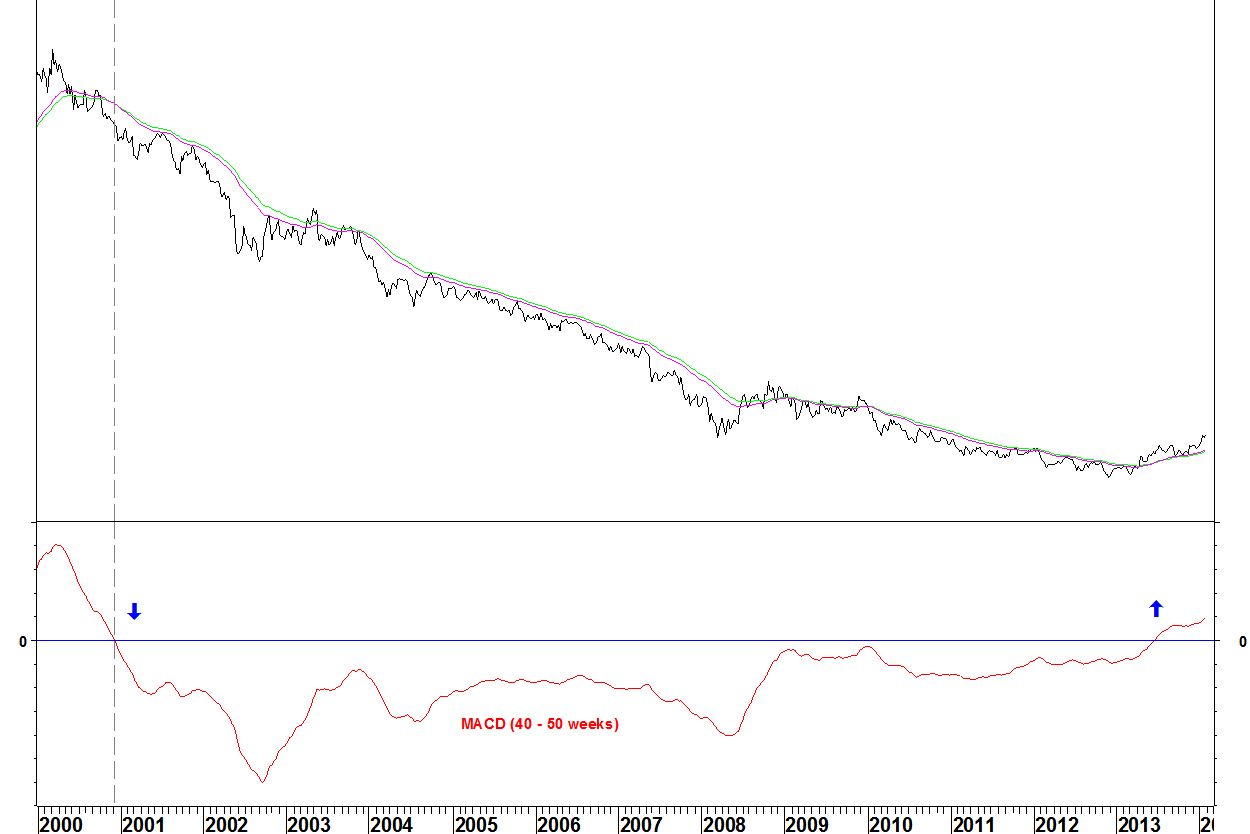
There is plenty more scope for this pair to rally in the long term.
GSK v BTI daily chart
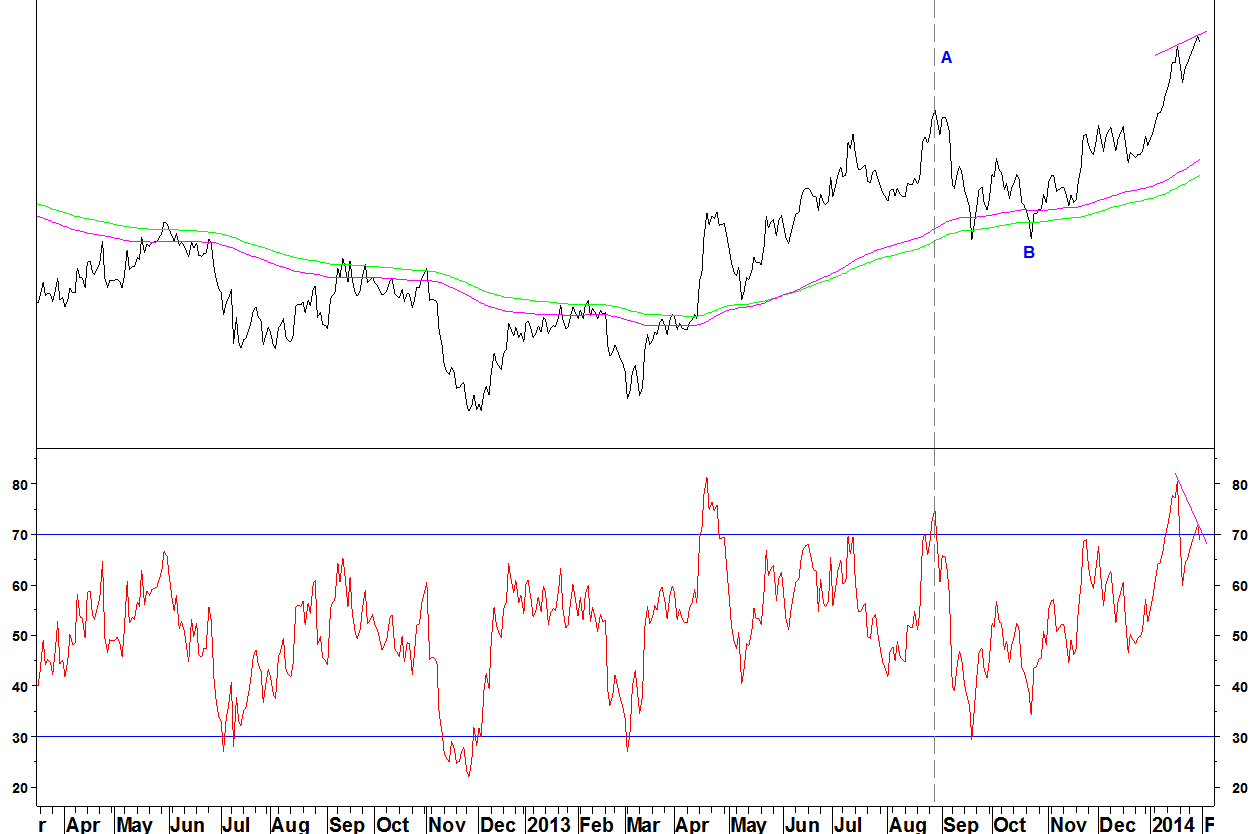
- On the daily chart, the pair has bearish RSI divergence
- In late August at A, the ratio and RSI peaked and it was eight weeks before the rally resumed at B
- The divergence is a better set up that A and the same could happen now – a multi week pull back towards rising moving averages
- That isn’t a good enough reason to short the pair, just to delay making a portfolio weighting switch
- When there is such a long term crossover daily divergences can be blown away but it would be unlikely that the pair leaves this level behind forever and continues higher
