19 November
On 22 October, I showed a sector pair of Philadelphia Banks Index (BKX) vs. S&P Railroads Index, showing the first moving average crossover since September 2004. This pair has traded sideways since then and these long term rotations can take a while to occur. For timing, we need other methods and a Bollinger Band breakout method is one possibility. The daily ratio chart is below.
- The 40 day moving average is rising
- The 40 day Bollinger Bands have contracted
- The 14 day RSI has unwound to mid range
- The high in March came with an RSI divergence, as did the start of the consolidation in October
- The RSI has unwound to mid range
The upper Bollinger Band has been broken but the bands still contract. The signal is a break above resistance level (shown in green) and an expansion of the band width.
Note that this is just an entry technique, the trade category is still a moving average crossover method. Therefore there is no ‘tightest bands in x periods’ criterion. In terms of stocks to trade this through, I did not find any examples that replicate the above chart, but I don’t have all day for that. Use the signal for asset allocation or have a more in depth look.The stop loss on this is a break back below the consolidation of the last two months. The range has been tight at only 4.4% from top to bottom and the potential upside is many times that.
19 November
During last week, I showed the potential for a Bollinger Band contraction on USDJPY to set up a breakout in favour of the USD. Last week, the Yen was weak against all currencies, here is the updated USDJPY chart.
The upper Bollinger Band was broken but the bands still moved closer together, so a breakout signal was not given, according to my breakout criteria.
Also, the bands have not moved quite as close (yet) as in February. If they don’t get to the tightest in three years, that criterion will not be met. I want trades that meet my criteria, to take advantage of any rally in USDJPY. This is where pairs trades can come into their own. Some of my pairs may seem obscure and the bid/ offer spread may not be tight on some components. However, they demonstrate what can be done and could be applied as over/ under weight positions by long only fund managers. A rally in USDJPY will likely lead to Japanese exporters performing better than Japanese domestic orientated stocks. From the available ADRs, one domestic stock that has potential to underperform is Nippon Telegraph and Telephone Corporation (NTT). Pairs trades against NTT: Bollinger Band breakout set ups I ran a Metastock scan on 182 ETFs, US sector and market indices and Japanese ADRs for series that, when charted as a pair against NTT, have contracted Bollinger Bands. The results showed 67 pairs to have (now or in the last five weeks), Bollinger Bands at their tightest for three years. This is an example of clustering of results. It tells us something is worth further investigation. These series are examined to see whether they fit the criteria outlined. Orix Corporation (IX) v NTT
The ratio has consolidated since March. It recently broke above the bands and pulled back in. A sustained break higher would be to new four year highs.
Kubota (KUB) v NTT

This has also consolidated since February and now breaks above the Bollinger bands. The original break above the band was not accompanied by increasing band width, so this is the first signal.
Mizuho Financial (MFG) v NTT
This had been in a downtrend for years. It has consolidated since March, contracting the bands. Watch for a break above the upper band and the 2012 resistance level. Preferably, the moving average should be rising and this isn’t currently the case.
SPDR Financial (XLF) v NTT
This has consolidated since March and awaits a breakout. The 40 week moving averages on these charts are rising. One of the criteria I added was to see a clearly trending moving average and to take breakouts in the direction of the average.
SPDR Retail (XRT) v NTT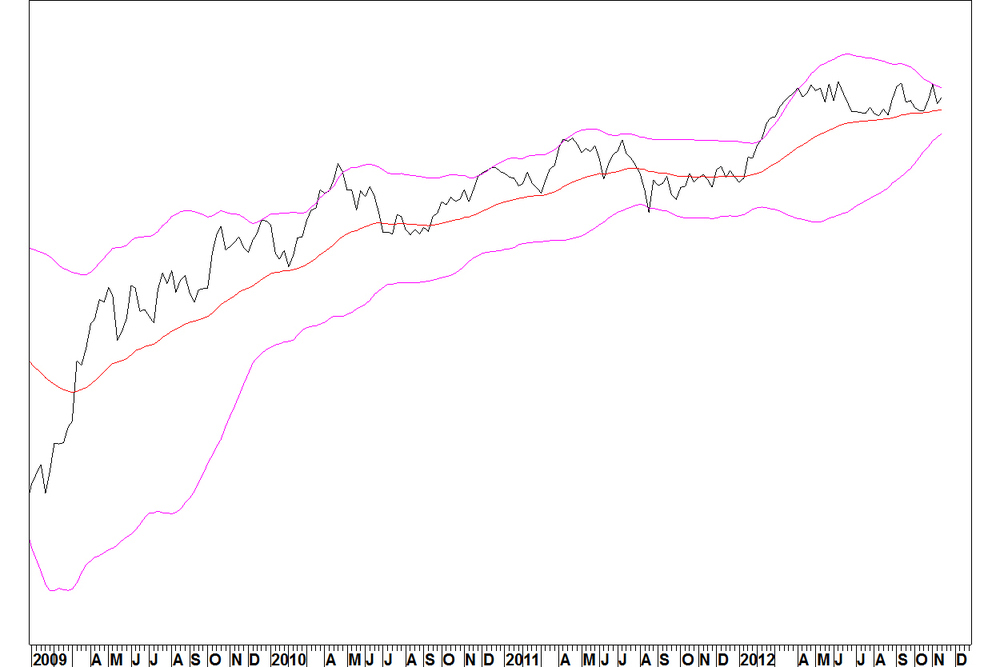
This has consolidated since April and awaits a breakout.
Conclusion I’m going to stick with the Japan stock trades. A weakening Yen may help the Japanese market outperform and there could be a ‘rising tide lifts all boats’ effect, even on some stocks like NTT that merit it less. A position in KUB v NTT is opened at 2.27571. The stop loss is at 1.89, shown by the green line. That is 17% lower but in practice, if the breakout doesn’t hold, the position would be cut before reaching that level. The IX v NTT trade needs a bit more proof that the break higher of early November will be maintained.14 November
Way back in April, I showed the potential for the US Dollar versus Yen chart to make a long term low, due to a moving average crossover. That crossover occurred twice but was not maintained and the rate has gone sideways since May.
That consolidation has allowed the 30 week Bollinger Bands to contract, close to the level of contraction of February, which preceded a sharp move.
USD v JPY
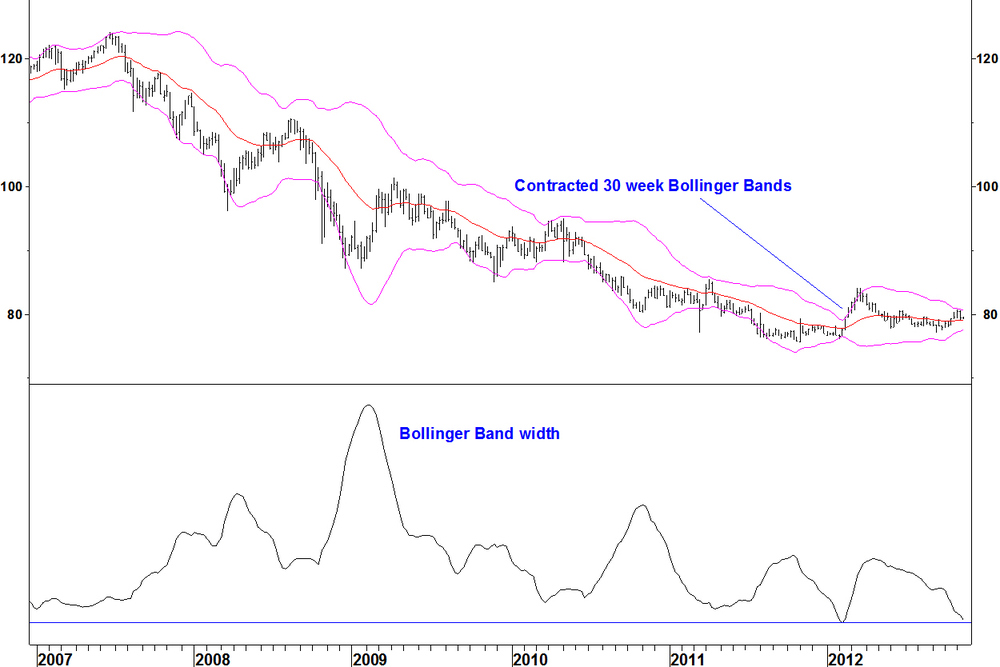
My Bollinger Band method looks for charts where the bands are contracted to their tightest in three years. That situation is close now.
When separate technical factors coincide, this improves the case for a market move. The band contraction might make the next moving average crossover stick in place.
I’ll return to this in the coming weeks. The entry signal for Bollinger Band trades is an end of week break beyond the bands with an expansion in the band width.
12 November
Last week, I closed the remainder of the short position in Apple. This proved wrong, as it declined another $32 by the end of the week.
Recent examples of daily RSI divergences prompted me to close the position. This short term focus ignored a longer term development, shown here. In my moving average crossover method, I look for stocks or pairs where the averages have had a long time since their last crossover: at least 2 years preferably 4 years. I also look for divergence on the MACD indicator. The signal is given by the moving average crossover. Scanning for stocks against Apple, there are many that meet the 2 year criteria and have just crossed over. Changing the criteria to 4 years shortens the list to financial stocks, ETFs and indices. Apple (AAPL) v SPDR Financial (XLF)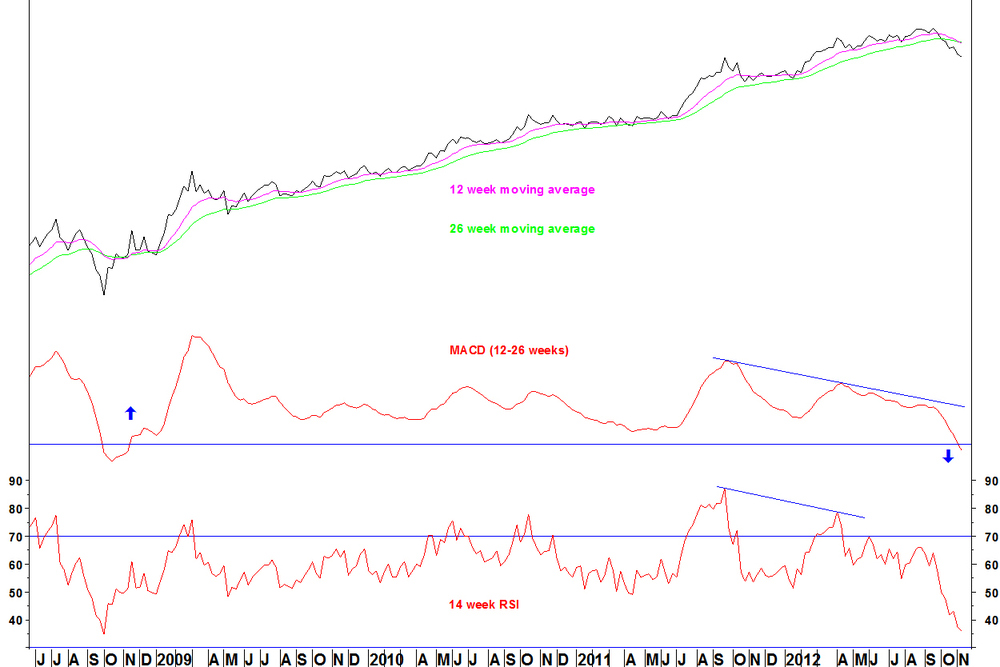
- Four years have passed since the last moving average crossover – in November 2008
- Divergence has been in place on the MACD indicator throughout 2012
- A bearish RSI divergence formed in April 2012
- The moving averages crossed over at the end of last week, signalling the long term rotation away from Apple and in favour of financial stocks
- In the short term the ratio is oversold
When long term rotations occur, short term oversold/ overbought can persist and short term divergences can be blown away. Thinking a bit more about the long term rotation could have helped with not taking profit too early on the Apple trade.
The long term crossover is not a precise timing signal. The ratio could easily rally back to the falling moving averages before falling again.
05 November
The remaining two thirds of the short position in Apple (AAPL) is closed today, at the current price of $578.78. The reason is as follows:
Several recent examples (National Bank of Greece v. S&P 500 Index and utilities verses autos) have shown it wise to close positions on reaching an RSI divergence on the daily chart. Daily divergences are not rare enough to open positions but they can be used as trigger to take profit. Whilst this has not been reached on the daily price chart, on pairs charts, some emerging market ETFs have bullish daily RSI divergences against Apple, for example: iPath India (INP) and iShares Mexico (EWW). In any case, Apple is very oversold against most stocks and ETFs on its daily chart. Apple is not the best short position choice now. This does not rule out further decline eventually, something I expect to happen. In the immediate term though, taking profit makes sense.
05 November
Here is the performance of the trades posted on this blog since March: Total performance Profitable trades: 7Losing trades: 5 Total %age points gained: 78.7%
Total %age points lost: 26.1% Gains: losses = 3.02:1 A couple of the trades have been closed out. I would show these with charts but at present, new charts are not loading, although old charts are back at least.
Utilities v auto retail
Two of the three utilities v auto retail trades from last week reached their break even stop loss and the third will be closed with a minimal profit. National Bank of Greece v S&P 500 Index The position was closed in three stages. The total profit was 19.2%.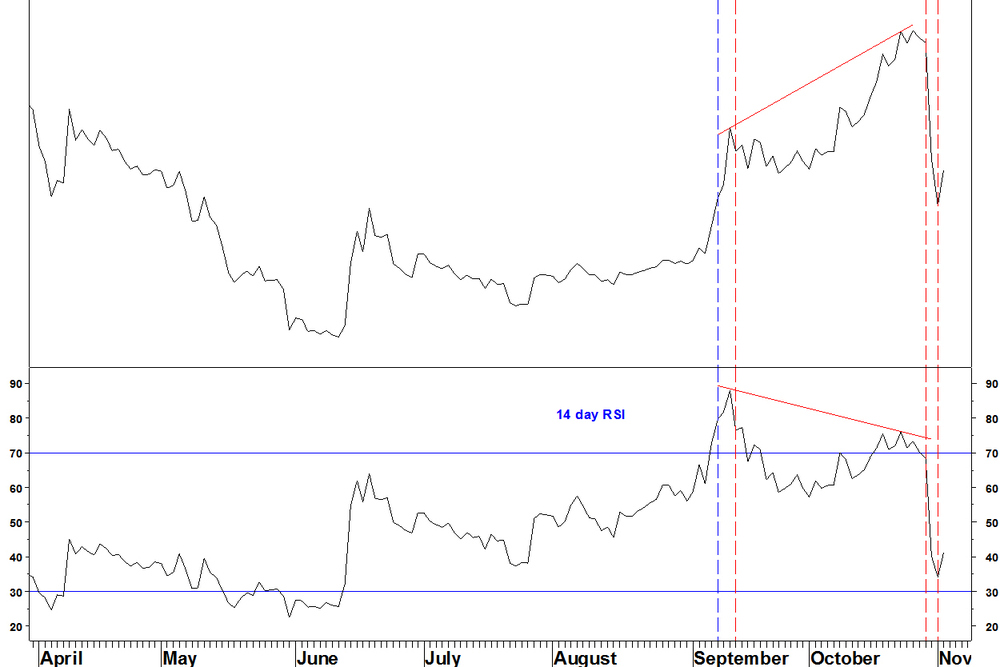
Apple
This short position still runs. One third has been closed and with the price now $576.80, total profit is 10.9%. This is the only position remaining. Effect of daily RSI divergences On the utilities v auto retail and National Bank of Greece trades, daily RSI divergences came into effect. I showed this on NBG on 29 October to close some of that trade and you can see it above again. One of the utilities v auto retail had bullish daily RSI divergence: Autozone (AZO) v Edison Intl (EIX).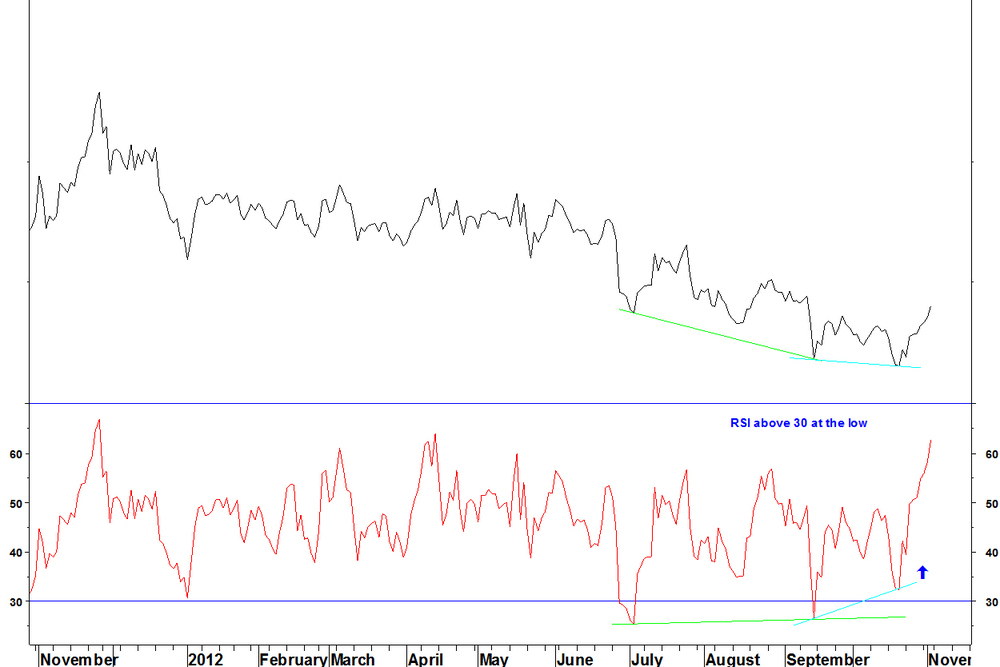
For my RSI divergence trades, I use daily divergences as a reason to exit but need weekly divergences for entries. This could have been noted and used, although with the long term moving average rotation having taken place, I wanted to give the trade the chance to work.
This is not the first time that there has been contradiction between aspects of my methods. I need to be aware of these times and in these cases, closing the position is the best option.
30 October
On 25 September, I showed that some of the long term rotations for utilities and against auto retail stocks had been signaled by a moving average crossover. The three trades are: Autozone (AZO) v Nextera Energy (NEE)O’Reilly Automotive Inc. (ORLY) v Nextera Energy (NEE)
Autozone (AZO) v Edison International (EIX) The crossover remains in place but last week there was a move against these pairs. I will move the stop loss on these three signaled trades to break even. Should that be triggered, we would have to wait for another set up to enter but that’s better than letting a profit run into a loss.
29 October
In my methods section, I state that daily RSI divergences can be used as a reason to take profit but that weekly divergences are needed to merit entering a position. I previously showed that daily divergences on their own are not enough to merit entering a position. The position in National Bank of Greece (NBG) v S&P 500 Index has had one third removed (on 13 September). I will now remove another one third. This is due to the daily RSI divergence that exits on this ratio.
The weekly chart however, has not yet reached overbought on the RSI.

This ratio could power much higher, how much is beyond the scope of what I do. I’m just pointing out that the daily divergence, which will likely bring at least a consolidation or pullback. There is no guarantee that a weekly overbought RSI will be reached.
22 October
Banks have underperformed since 2007 and against some sectors, for even longer but now, they are starting turn around, at least relative to some other sectors. With my moving average crossover method, I look for prices or pairs without a moving average crossover for four years. I also look for divergence on the MACD and supporting evidence from other methods. These exist for the banks. Philadelphia Banks Index (BKX) vs. S&P Railroads Index
- The 30 and 40 week moving averages last crossed in September 2004!
- The low in November 2011 was formed with a MACD divergence against the 2008 and 2009 lows
- Notice that MACD and RSI divergences were formed at the February 2009 low and an RSI divergence formed at the November 2011 low
- The moving averages have just crossed again, giving the long term rotation signal
A similar moving average cross has occurred against the S&P Industrial Machinery Index and crosses appear imminent against consumer discretionary sector indices.
In terms of entering a trade, the sector is setting up according to my Bollinger Band breakout criteria against a number of ETFs, in particular, country ETFs or broad emerging market ETFs. One pair that I will revisit on another night is: Market Vectors Regional Banks (RKH) vs. iShares Pacific ex Japan (EPP)
22 October
Last week, I showed how breadth divergences can be used to pick a buying opportunity – especially if combined with momentum divergences. Extremes will not always appear with divergence, sometimes the breadth indicator is range bound. This example shows the iShares Dow Jones U.S. Oil Equipment & Services Index Fund (IEZ), an ETF with 46 components. The breadth indicator is the percentage of stocks above their 200 day moving average. It is calculated in FIRE, my customisable breadth product, using the exact list of 46 ETF components.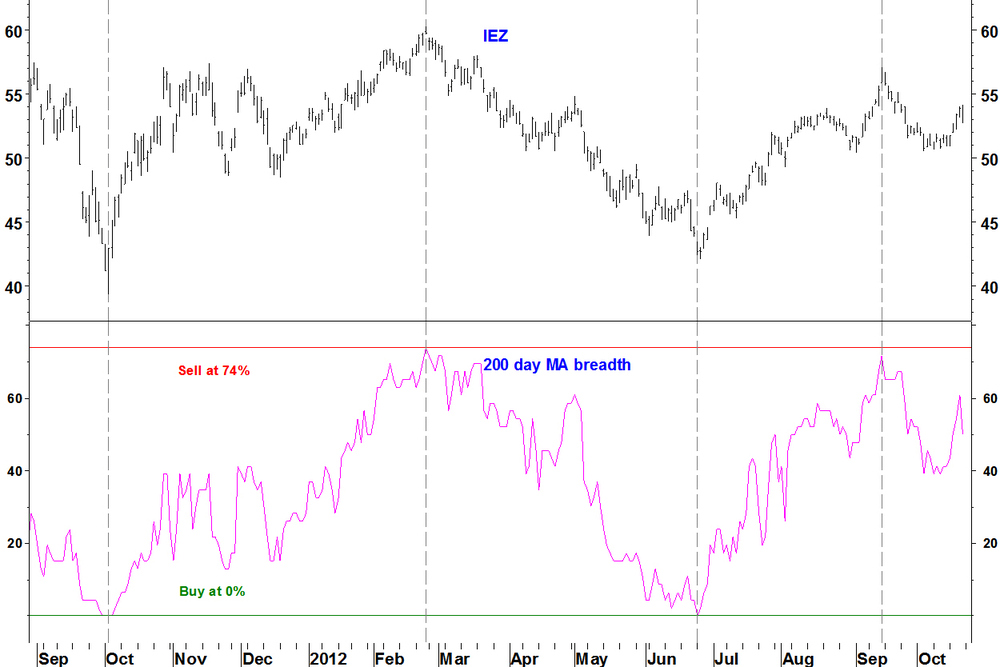
- In early October 2011, breadth falls to 0% – every stock is below its 200 day moving average. This marks a low for IEZ
- The high for IEZ forms in February 2012 with the breadth indicator at 74%
- IEZ makes its low in late June 2012 with breadth again at zero
- IEZ peaks again in September 2012 with breadth at 72%. It doesn’t quite reach the previous high but the knowing it was close could alert you and profit could be taken on the first reversal day – 17 September
- There are no breadth divergences at any price extreme, this series has displayed range bound breadth
- No turning points match my RSI divergence criteria, like last week’s example. They show some daily RSI characteristics that, when taken together with the breadth, strengthen the case for a reversal
- Now, breadth stands at 50%. It has not yet fallen to a buy point
