USDJPY Bollinger Band contraction sets up possible breakout
14 November
Way back in April, I showed the potential for the US Dollar versus Yen chart to make a long term low, due to a moving average crossover. That crossover occurred twice but was not maintained and the rate has gone sideways since May.
That consolidation has allowed the 30 week Bollinger Bands to contract, close to the level of contraction of February, which preceded a sharp move.
USD v JPY
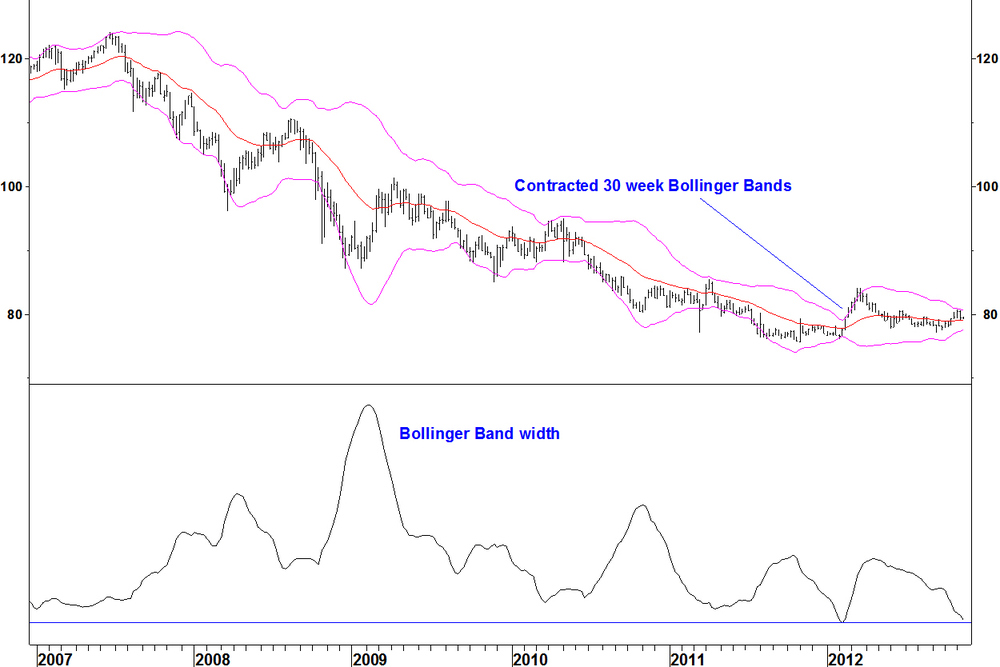
My Bollinger Band method looks for charts where the bands are contracted to their tightest in three years. That situation is close now.
When separate technical factors coincide, this improves the case for a market move. The band contraction might make the next moving average crossover stick in place.
I’ll return to this in the coming weeks. The entry signal for Bollinger Band trades is an end of week break beyond the bands with an expansion in the band width.
