Range bound breadth indicators – identify turning points using breadth extremes
22 October
Last week, I showed how breadth divergences can be used to pick a buying opportunity – especially if combined with momentum divergences. Extremes will not always appear with divergence, sometimes the breadth indicator is range bound. This example shows the iShares Dow Jones U.S. Oil Equipment & Services Index Fund (IEZ), an ETF with 46 components. The breadth indicator is the percentage of stocks above their 200 day moving average. It is calculated in FIRE, my customisable breadth product, using the exact list of 46 ETF components.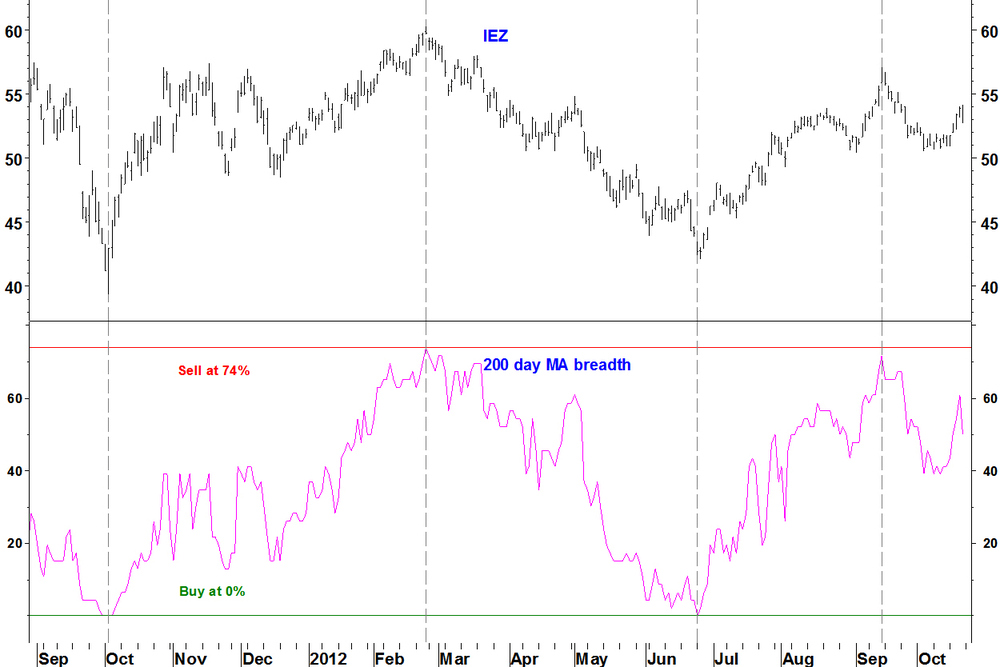
- In early October 2011, breadth falls to 0% – every stock is below its 200 day moving average. This marks a low for IEZ
- The high for IEZ forms in February 2012 with the breadth indicator at 74%
- IEZ makes its low in late June 2012 with breadth again at zero
- IEZ peaks again in September 2012 with breadth at 72%. It doesn’t quite reach the previous high but the knowing it was close could alert you and profit could be taken on the first reversal day – 17 September
- There are no breadth divergences at any price extreme, this series has displayed range bound breadth
- No turning points match my RSI divergence criteria, like last week’s example. They show some daily RSI characteristics that, when taken together with the breadth, strengthen the case for a reversal
- Now, breadth stands at 50%. It has not yet fallen to a buy point
Leave a Comment
