14 January
Yesterday, I showed that InterActiveCorp resumed its underperformance, following a long term moving average crossover. The pair moved sideways through most of December, frustrating if you have it as a trade, only to reassert sharply in the New Year.
Here is what has happened to some moving average crossover trades that I showed in September. These were closed in early November (two at break even, one for a small gain), as they did not make progress and I did not want a profit to run into a loss. Since then, long term top formations have continued to develop. Autozone (AZO) v Nextera Energy (NEE)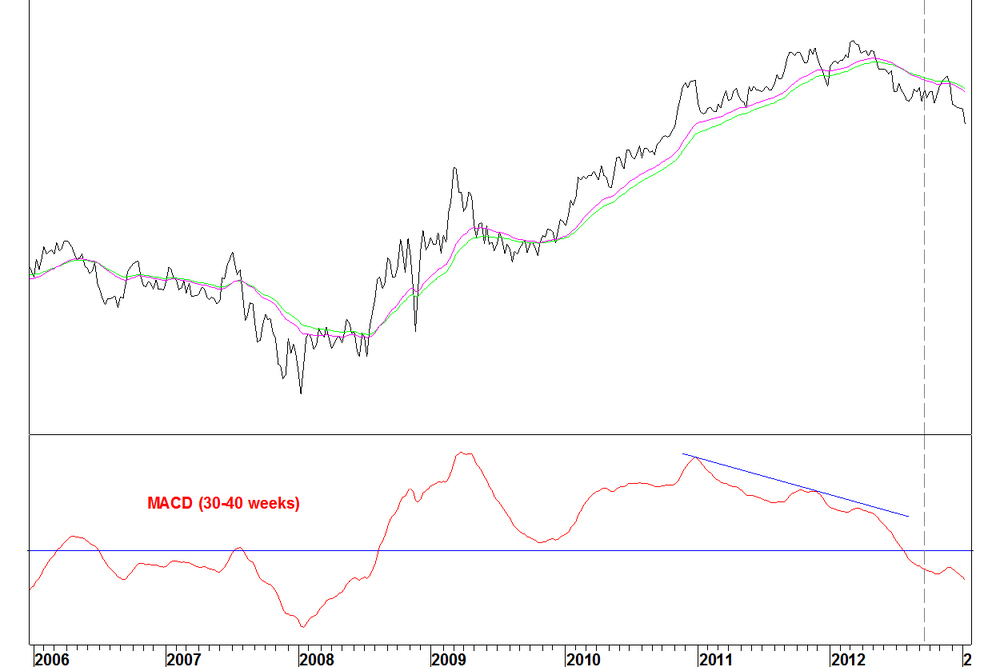
Fall of 11.8% for the ratio since 25 September
O’Reilly Automotive (ORLY) v Nextera Energy (NEE)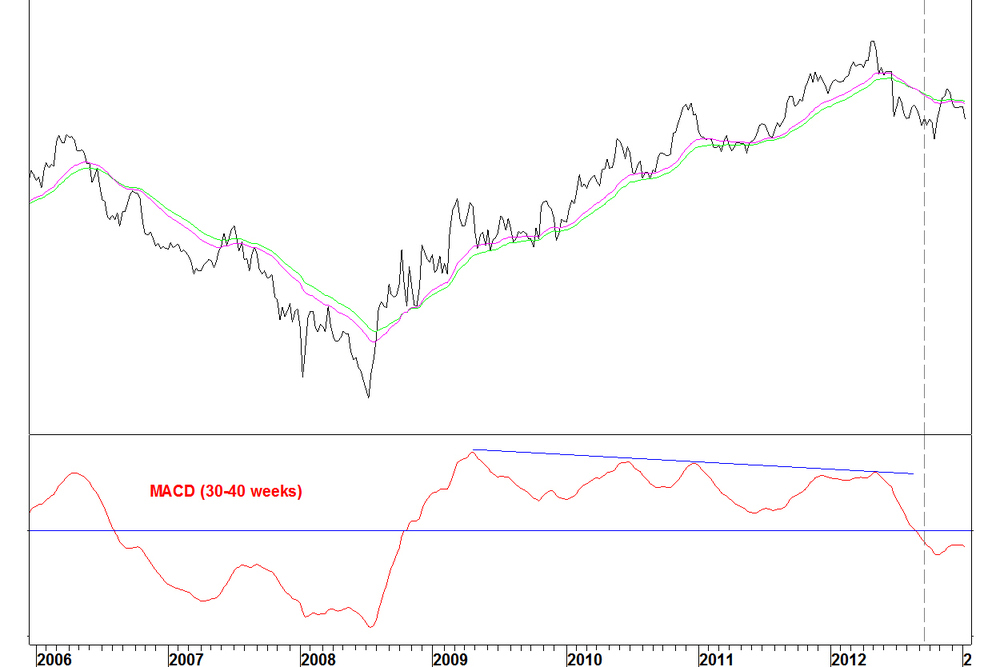
Fall of 0.1% for the pair since 25 September
Autozone (AZO) v Edison International (EIX)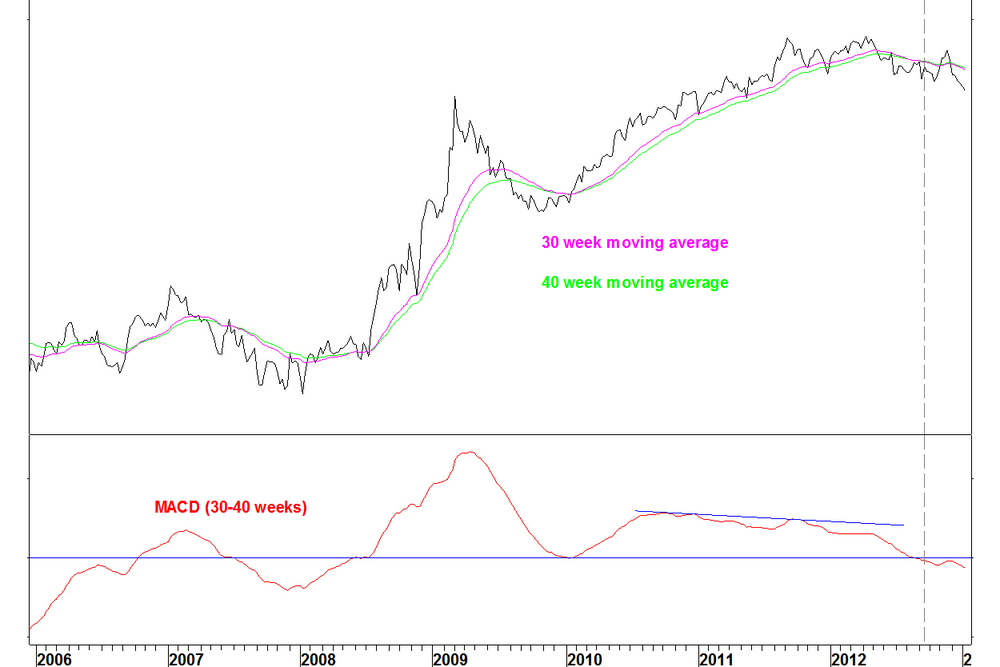
Fall of 9.1% for the pair since 25 September
Conclusions- Following moving average crossovers that meet my criteria, it can take months for the trend change to develop, including moves against the trend change
- If they don’t work, they don’t have a very quick way of letting you know
- They are not suitable directly as trades but can be used for long term allocation decisions
- For a practical trading use, they can inform trades that are more quickly resolved, such as with the Japanese stock pair of Kubota (KUB) v Nippon Telegraph & Telephone (NTT), which recently achieved a 20% gain.
13 January
InterActiveCorp, or IAC (ticker: IACI), was shown on 03 December, as an example of a stock that fitted my moving average crossover method.
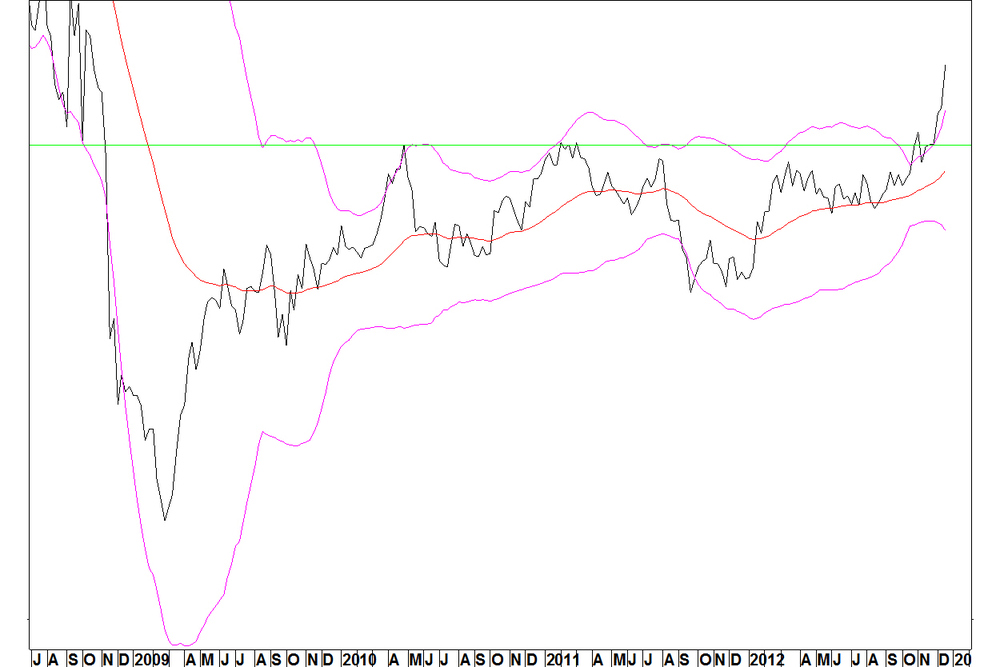
I do not record and track trades for these examples as I do for my Bollinger Band and RSI divergence trades. The reason is that they don’t have a defined entry method like the other two. Instead, they show that a trend in place for a long time has changed. Exactly how that change pans out can vary hugely. Dow Jones Food Index vs. IACI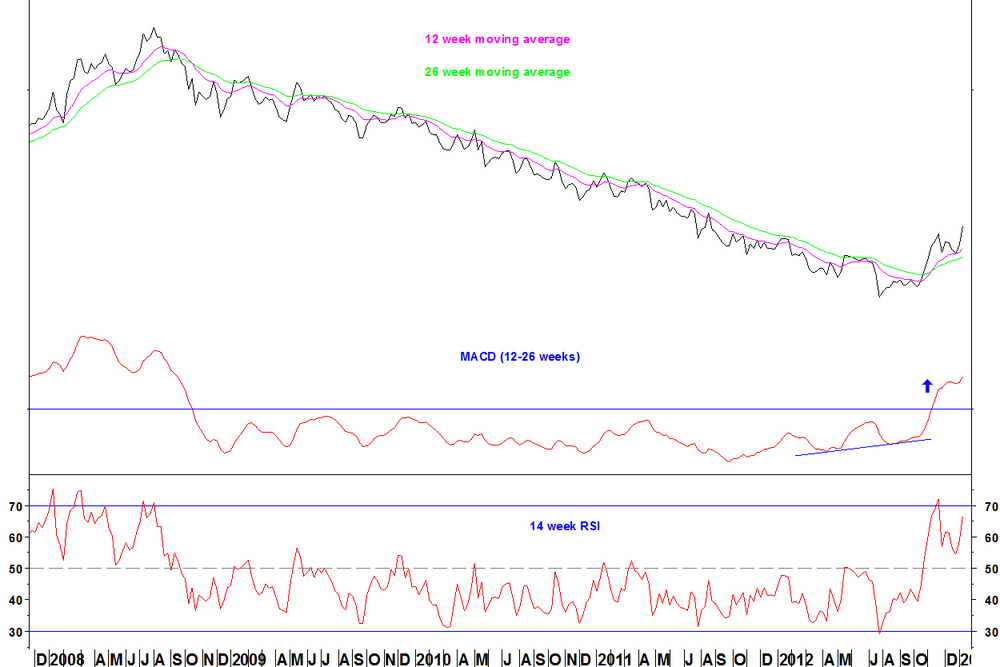
- The moving averages crossed in October 2008 and did not cross again until mid November 2012. It meet the criterion of there being four years since the last crossover
- There was divergence on the MACD indicator at the low. My MACD takes account of the fact that values are getting smaller as the chart progresses. That makes the divergence genuine rather than just being because values are shrinking
- Having pulled back to the shorter term moving average, the ratio has rallied to a new high
Daily chart
This shows how much variation there can be in these long term rotations.

- The ratio rallied quickly after being first shown but then pulled back through most of December
- Since the turn of the year, the ratio has made a new high
Example stocks versus IACI
Example stocks were shown in the first example from the consumer staples sector. There is good commonality for ratio charts across the consumer staples sector against IACI. Conclusion These long term rotation charts are more suited to fund managers making long term allocation and weighting decisions. For a short term trader, they do not provide a defined entry method. Ongoing trades The current trade of SPDR Financials (XLF) v SPDR Energy (XLE) has a 2.1% gain. The stop loss is moved to break even.08 January
The best examples of my Bollinger Band breakout trades move into profit quickly. The position in WFC v BXP signalled a breakout but then didn’t follow through, so now it is in a position of hoping that it eventually does.
Rather than wait to see if it does, I’m going to close it for a 2.1% loss. After all, the justification for the trade, a break higher from a band contraction has not occurred.
The position in XLF v XLE (Financials versus Energy ETFs) has a 2.0% gain so far.
07 January
On the pair of Kubota (KUB) v Nippon Telegraph & Telephone (NTT), I closed half of the position with a 17.2% gain and the remaining half has a 22.7% gain. Kubota (KUB) v Nippon Telegraph & Telephone (NTT)
This pair was based on the expectation of Yen weakness and now, the Yen is oversold against all currencies. Therefore, it makes sense to close the position.
US Dollar v Yen: 50 week Disparity Index The chart shows the 50 week moving average (exponential) and below it, the percentage that the price is above or below this moving average.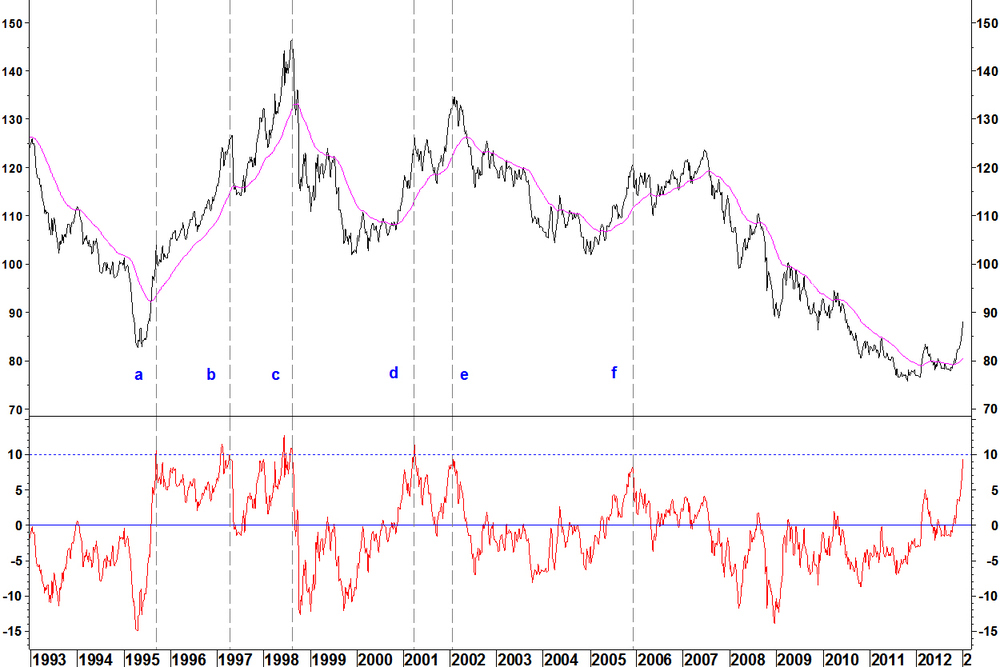
There is a sustained uptrend in the late 1990s but even then, the Disparity Index (DI) offers something, albeit in hindsight. Here are the points of overextension for the DI:
- a – September 1995: The DI reaches 11.3% in September 1995. The overbought condition is unwound and price consolidates for three and a half months
- b – April 1997: The DI peaked in February at 11.5% but the price peak came in April
- c – August 1998: The DI peaked in June at 12.7% but the price peak came in August
- d – March 2001: The DI peaked at 11.5%, with the price
- e – January 2002: The DI peaked at 9.6%, with the price
- f – December 2005: The DI peaked at 8.1%, with the price
Now, the DI stands at 9.4%. DI peaks have come at around 10%, not always exactly with price peaks with little further gain. Even in 1995, at the start of a sustained uptrend, it can take months for price to unwind from overbought. If a long term uptrend is starting now, a pull back towards the 50 week moving average could take many months.
On balance, it is best to close the KUB v NTT position now with a 20% gain overall. Yen weakness trade ideas can be revisited once the currency extension has unwound, if they meet my entry criteria.
24 December
It is Christmas Eve, I should be taking a break, but I must record that two potential trades I have been monitoring gave their entry signals on Friday. On 26 November, I showed Wells Fargo (WFC) v Boston Properties (BXP) as a potential Bollinger Band breakout trade. Wells Fargo (WFC) v Boston Properties (BXP)
This pair meet the criteria of having the tightest bands for three years. The entry signal of an end of week break above the upper band and an expansion of the band width was given.
SPDR Financials (XLF) v SPDR Energy (XLE)
The same entry criteria as above were met on Friday. Positions in these two pairs are opened.
The stop loss is initially a move below the lower band but this can change with the trade. If the breakout follows through, the bands will expand and that stop loss would be too far away. If the ratio meanders sideways, the trade can be cut without a specific level being reached. Only on a sharp move down would the stop loss be reached but anyway, trades that don’t go to plan can be cut before stop losses are reached. The banks v railroads trade idea shows a bit of progress but two of these trades is enough. Update on Japanese stock pair The pair of Kubota (KUB) v Nippon Telegraph & Telephone (NTT) continues to progress, showing a 17.2% gain. Kubota (KUB) v Nippon Telegraph & Telephone (NTT)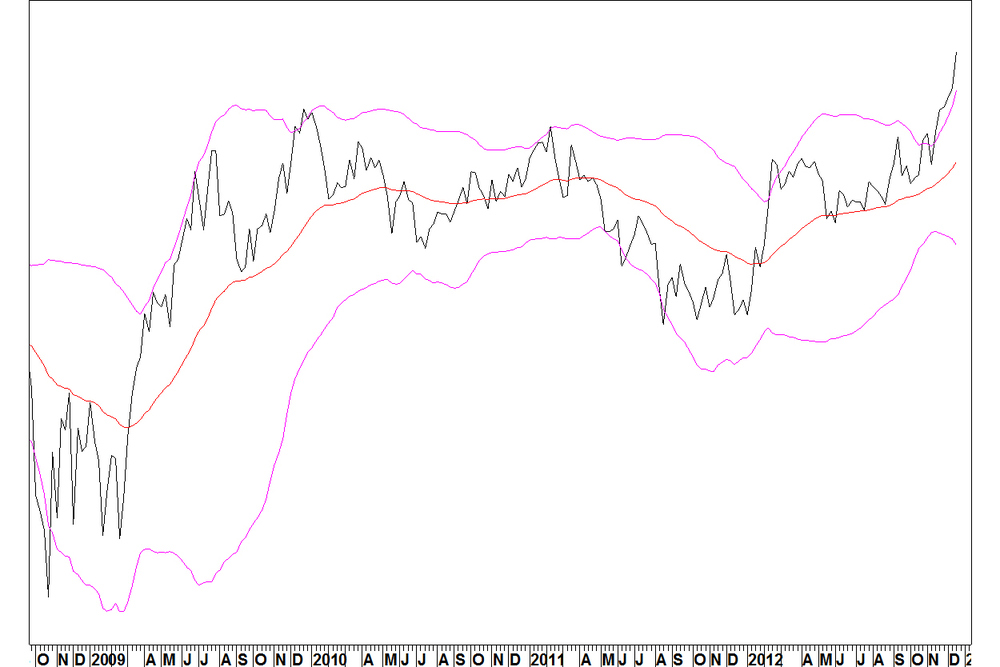
It is time to close half of the position and move the stop loss to break even. In practice, I wouldn’t let this move all the way back to break even.
This trade was backed up by an expectation of Yen weakness and by the commonality shown, with other stocks against NTT showing Bollinger Band set ups. From the 19 November posting, the Orix (IX) v NTT ratio has broken above the green, multi year resistance level due to the relative weakness of NTT.Orix (IX) v Nippon Telegraph & Telephone (NTT)
17 December
I have shown several examples of financial stocks setting up for outperformance. Financials is the best performing sector today and one of these trade ideas is lining up for entry. On 26 November, I showed Wells Fargo (WFC) v Boston Properties (BXP) as a potential Bollinger Band breakout trade. With WFC up 3.38% as I write, the ratio has broken the upper Bollinger Band and is at the green line on the chart. Wells Fargo (WFC) v Boston Properties (BXP)
This move would have to be sustained until the end of the week to give a signal according to my breakout criteria.
The banks v railroads trade idea is not as close to being triggered. In addition, the financial sector is poised to outperform the energy sector and this will be signalled by an end of week Bollinger band breakout, meeting my criteria. SPDR Financials (XLF) v SPDR Energy (XLE)
This pair meets the criteria of having the tightest bands for three years.
Update on Japanese stock pair The pair of Kubota (KUB) v Nippon Telegraph & Telephone (NTT) continues to makes progress and as I write, shows a 10.0% gain. This trade was backed up by an expectation of Yen weakness, but still had to meet the entry criteria for Bollinger Band trades. Kubota (KUB) v Nippon Telegraph & Telephone (NTT)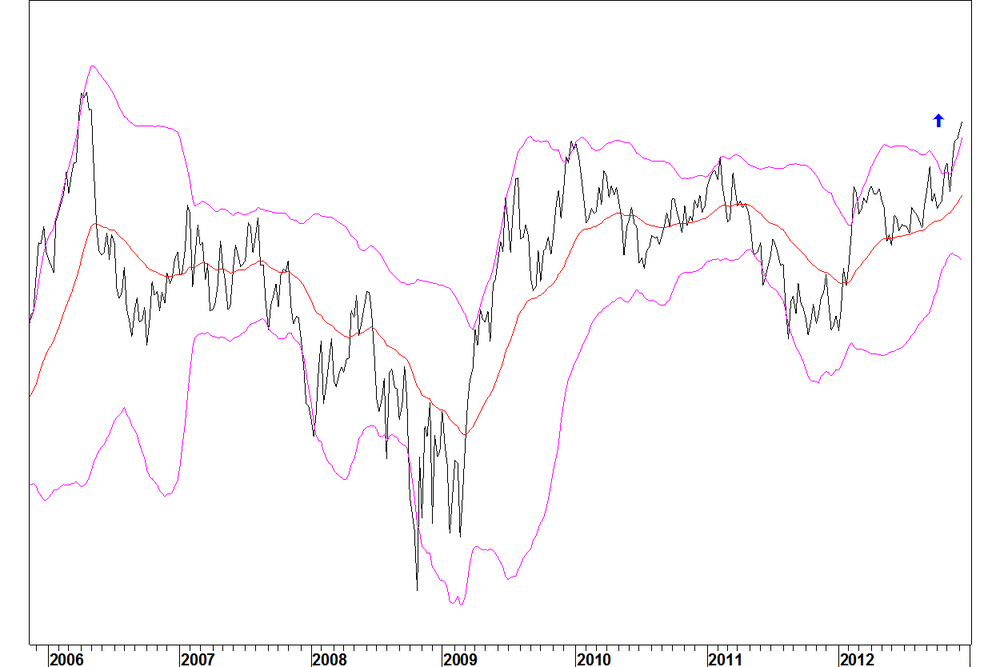
From the 19 November posting, the Orix (IX) v NTT ratio has broken above the green, multi year resistance level due to the relative weakness of NTT.
10 December
With the Metastock charting software add-on FIRE, I can create breadth indicators on any group of stocks. With the Philadelphia Gold & Silver Index (XAU) having fallen 17% since 21 September, I looked at whether breadth indicators are oversold.
The XAU has 16 components and breadth indicators were calculated on these stocks. That is quite small for a breadth group but going beyond this does not improve the correlation between breadth and the index. You then include some very small and ill companies, that show little history of responding positively to a rising gold price or a rising XAU index. XAU and percentage of stocks above their 50 day moving average
Points to note
- The %age of stocks above their 50 day moving average is currently zero, an oversold breadth reading
- Breadth at zero marked good buying points many times in the last two years. Dates marked 1, 2, 3, 6 and 7 all picked out lows
- Date 4 gave a two week wait for the low, whereas date 8 only marked a temporary reprieve
- At date 5, breadth reached zero and then stayed low, whilst XAU fell for another two months, until zero breadth was recorded again at date 6
The 50 day breadth often picks out good buying points but occasionally, low breadth is maintained and price continues lower.
Calculating breadth on a longer moving average gives fewer extreme readings. XAU and percentage of stocks above their 200 day moving average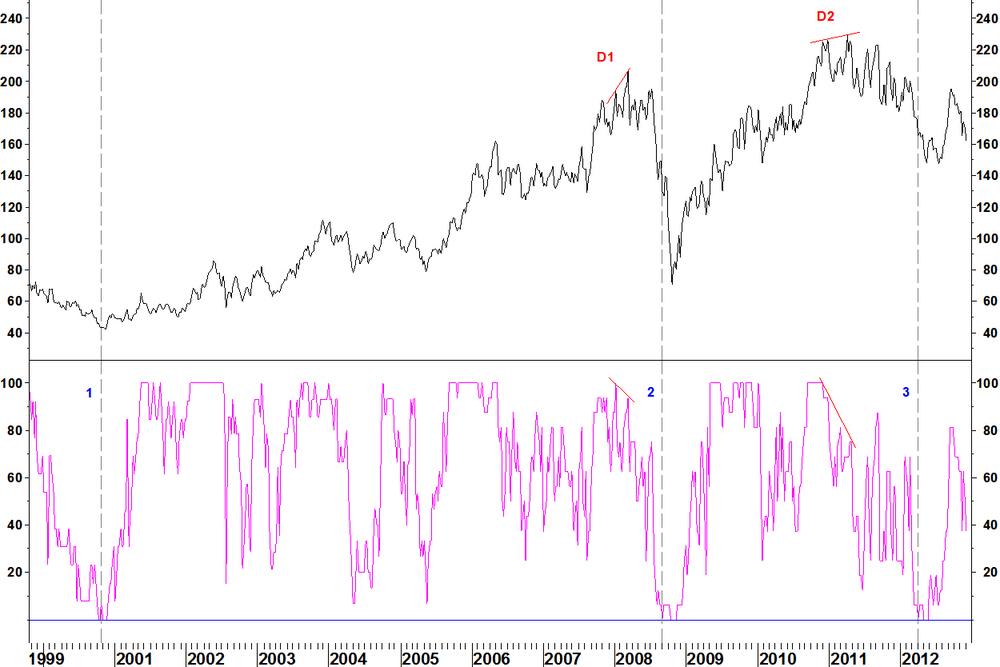
The percentage of stocks above their 200 day moving average has only reached zero in three periods since 1999.
1 At the long term low for XAU, in late 19992 During the 2008 crash
3 During spring 2012 Points to note
- A 200 day moving average breadth reading of zero has led to a good buying opportunity all three times
- Each time, breadth remains low for a month or two and price falls further
- The continued decline was modest in 1999, large in 2008 and in 2012, somewhere in between at 10.6%
- Breadth divergences mark peaks in March 2008 (D1) and April 2011 (D2)
- Breadth is now mid range at 37.5%
Current situation
The 50 day breadth indicator is oversold, so there may be a bounce from here, which could have started today. With longer term breadth mid range, this is not a reliable long term low. There is always the risk that low short term breadth is maintained, like with date 5 on the first chart. Combining breadth with other indicators When a long term breadth low is reached, you can turn to other indicators to pick a low on stocks. My turn picking indicator is to look for weekly RSI divergences. This bit is hindsight analysis but it demonstrates the point. Pan American Silver (PAAS)
- In late July 2012, a bullish weekly RSI divergence is formed on PAAS, coinciding with a MACD divergence
- The daily chart of PAAS also has a bullish RSI divergence against the May low
- This coincides with date 7 on the 50 day breadth chart, a move down to zero breadth
- 200 day breadth had moved off zero but was still low at 12.5% (2 stocks out of 16 above their 200 day moving average)
- This combination provides a good, low risk, high reward entry on PAAS
Current situation
No gold stocks show weekly RSI divergence set ups. RSI values are mostly mid range, tying in with the 200 day sector breadth being mid range. Wait for a clearer opportunity for a good trade on gold stocks.03 December
InterActiveCorp, or IAC (ticker: IACI), has been an outperformer during this bull market but a sharp drop in October and early November took it below a previous low for the first time since basing in 2009. I scanned for sectors and ETFs for which, when shown as a pair against IACI, met the criteria for the moving average crossover method. The results were centered around the consumer staples sector. Here is one example:Dow Jones Food Index vs. IACI.
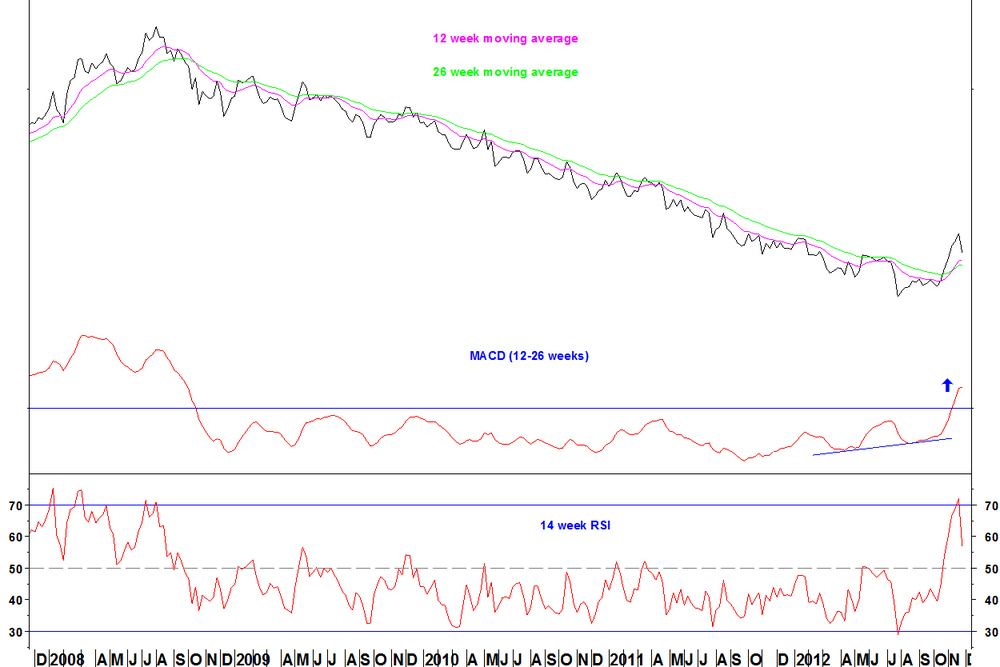
Points to note:
- The moving averages crossed in October 2008 and did not cross again until mid November 2012. That meets the criterion of there being four years since the last crossover
- There is divergence on the MACD indicator at the low. My MACD takes account of the fact that values are getting smaller as the chart progresses. That makes the divergence genuine rather than just being because values are shrinking
- The RSI never got far above 50 or for very long during the downtrend but now it has gone decisively above 50
- The method does not give a precise entry method like my RSI divergence or Bollinger Band methods. It just tells you something has changed. You’ll need to watch for signs of this pullback into the moving averages ending and a base forming
Example stocks versus IACI
Many of the consumer staples sector indices and stocks look similar against IACI, whether they are cover producers or retailers. Stocks examples are: Kroger (KR)Pepsico (PEP)
Proctor & Gamble (PG)
Sysco Corp (SYY) Quick summary of the other trades being followed
- Kubota (KUB) v Nippon Telegraph (NTT): Now shows an 8.0% gain after entry two weeks ago!
- Well Fargo (WFC) v Boston Properties (BXP) (26 Nov): Entry signal not given yet
- Banks v Railroads (19 Nov): Entry signal not given yet
26 November
Last week, the Japanese trade of Kubota (KUB) v Nippon Telegraph and Telephone Corporation (NTT) was opened. This made 5.5% on the week, although it has pulled back 1.4% of that today.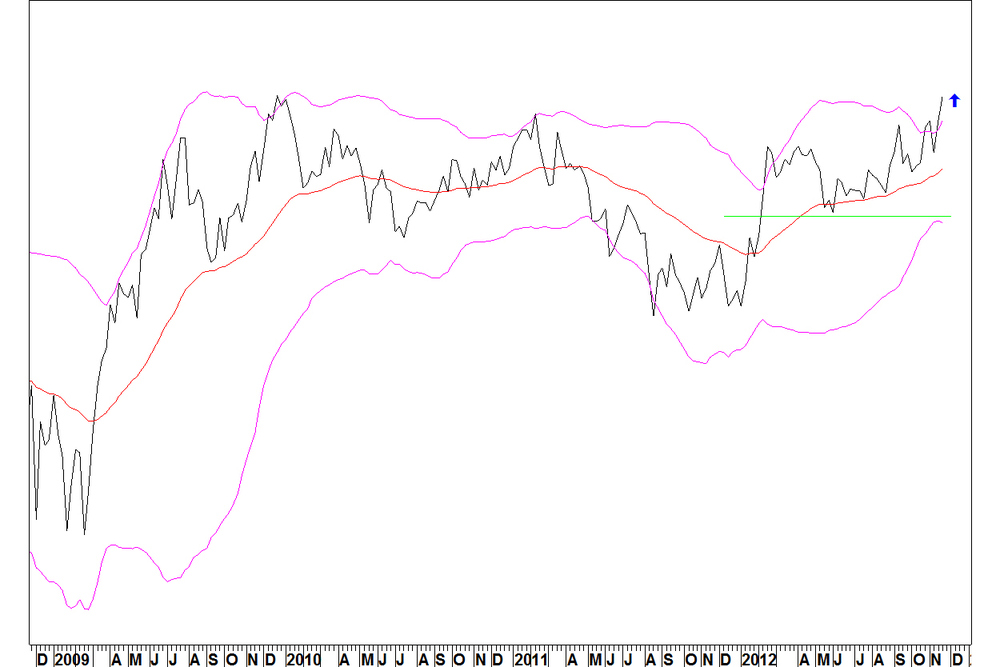
It is good to ensure a profit doesn’t run into a loss and to move the stop loss to break even as soon as possible. I’ll do that today. As just mentioned in the WFC v BXP article, the best examples of Bollinger Band breakout trades tend not to pull back far or for long. A pullback all the way to break even is not healthy for the trade.
The trade idea of long banks short railroads has still not broken the resistance level shown in last week’s posting.
26 November
I have shown some stock ideas with financials on the long side recently and here is another one. This is an example of a Bollinger Band contraction, with the ratio of Wells Fargo (WFC) v Boston Properties (BXP) having the tightest 40 week Bollinger Bands since December 2003.
The signal, as defined in the methods section is a break above the upper band along with an expansion of the band width on an end of week basis.
The 40 week moving average is trending up and I am only interested in trading a break of the bands in that direction. The stop loss is below the 16 October low on the daily ratio chart, at 0.3 on the ratio, 6.9% below the level of Friday’s close. As with other Bollinger Band breakout trades, if this doesn’t follow through fairly quickly, it could be cut before the stop is reached. The best examples of these follow through quickly. This is a trade that would benefit from rising interest rates, with a bank receiving higher interest on its loans and a real estate company paying out more interest.