The issue with long term moving average crossovers as trades
14 January
Yesterday, I showed that InterActiveCorp resumed its underperformance, following a long term moving average crossover. The pair moved sideways through most of December, frustrating if you have it as a trade, only to reassert sharply in the New Year.
Here is what has happened to some moving average crossover trades that I showed in September. These were closed in early November (two at break even, one for a small gain), as they did not make progress and I did not want a profit to run into a loss. Since then, long term top formations have continued to develop. Autozone (AZO) v Nextera Energy (NEE)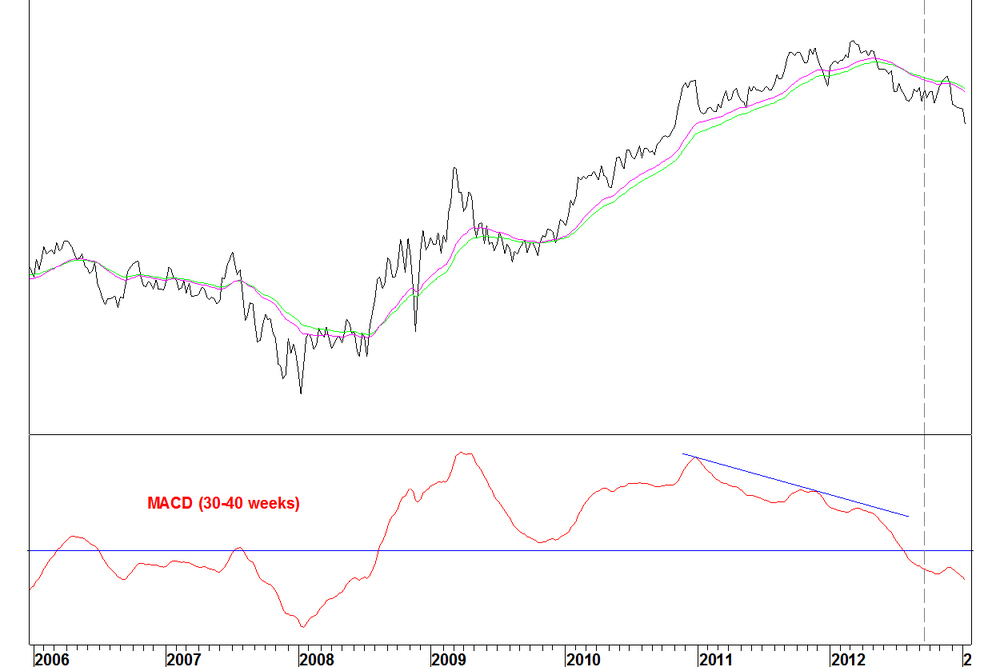
Fall of 11.8% for the ratio since 25 September
O’Reilly Automotive (ORLY) v Nextera Energy (NEE)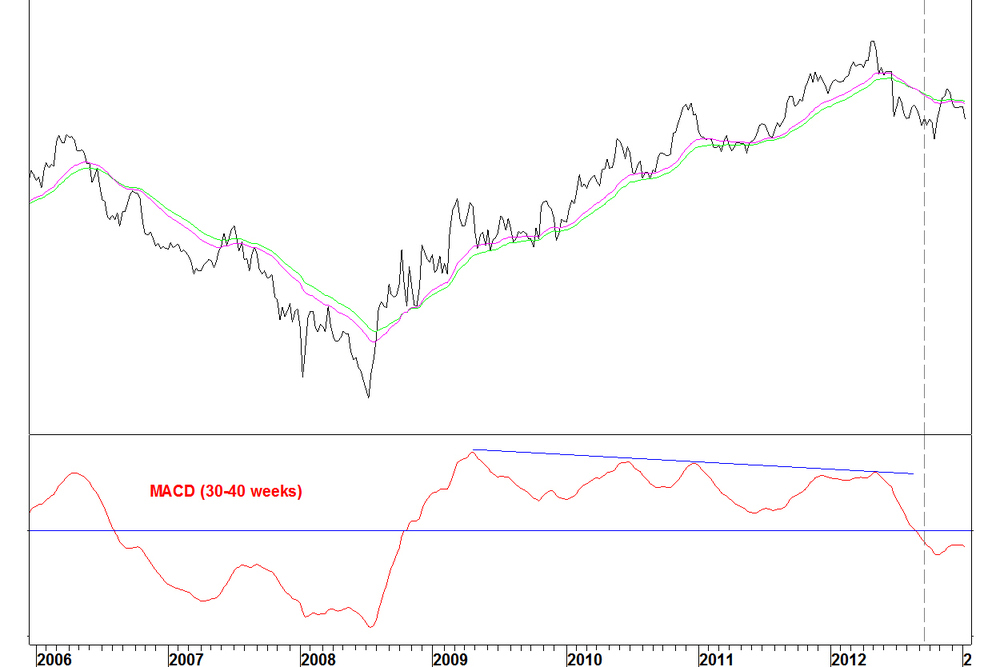
Fall of 0.1% for the pair since 25 September
Autozone (AZO) v Edison International (EIX)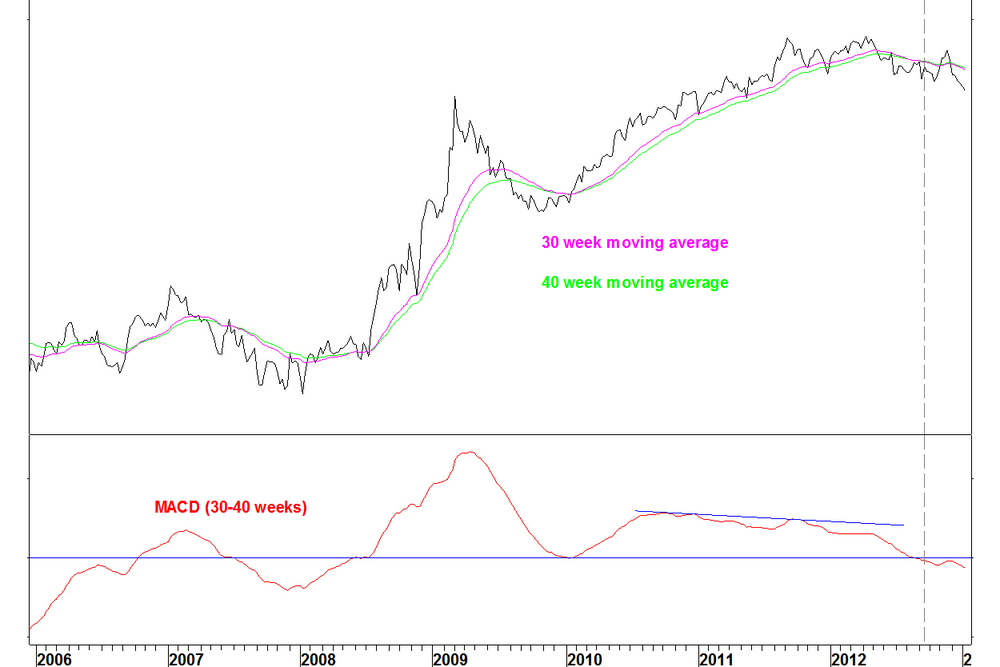
Fall of 9.1% for the pair since 25 September
Conclusions- Following moving average crossovers that meet my criteria, it can take months for the trend change to develop, including moves against the trend change
- If they don’t work, they don’t have a very quick way of letting you know
- They are not suitable directly as trades but can be used for long term allocation decisions
- For a practical trading use, they can inform trades that are more quickly resolved, such as with the Japanese stock pair of Kubota (KUB) v Nippon Telegraph & Telephone (NTT), which recently achieved a 20% gain.

Trackbacks & Pingbacks