InterActiveCorp continues move to underperformance
13 January
InterActiveCorp, or IAC (ticker: IACI), was shown on 03 December, as an example of a stock that fitted my moving average crossover method.
I do not record and track trades for these examples as I do for my Bollinger Band and RSI divergence trades. The reason is that they don’t have a defined entry method like the other two. Instead, they show that a trend in place for a long time has changed. Exactly how that change pans out can vary hugely. Dow Jones Food Index vs. IACI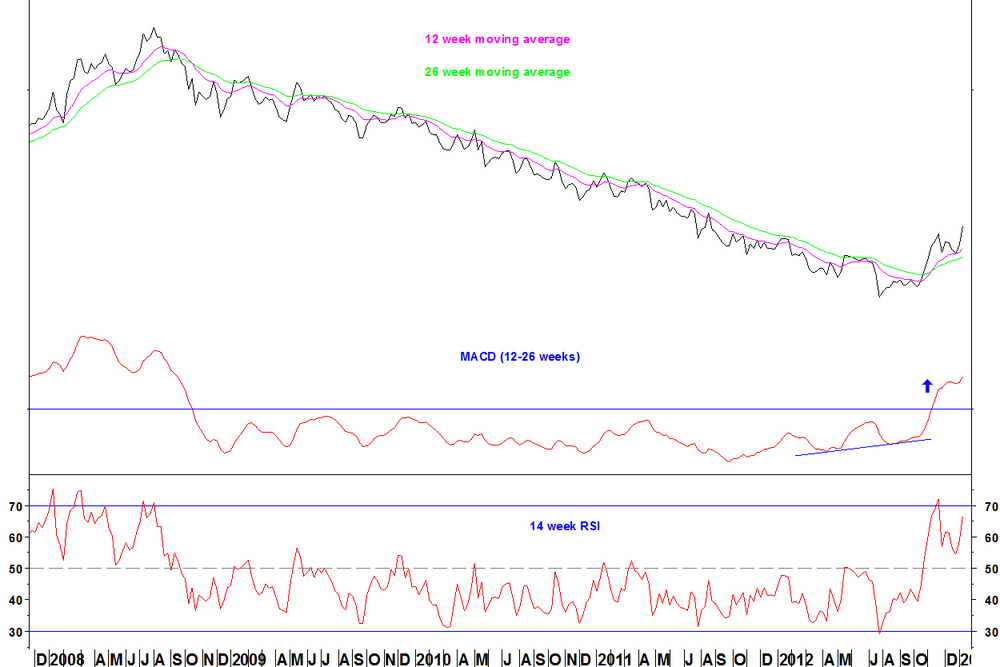
- The moving averages crossed in October 2008 and did not cross again until mid November 2012. It meet the criterion of there being four years since the last crossover
- There was divergence on the MACD indicator at the low. My MACD takes account of the fact that values are getting smaller as the chart progresses. That makes the divergence genuine rather than just being because values are shrinking
- Having pulled back to the shorter term moving average, the ratio has rallied to a new high
Daily chart
This shows how much variation there can be in these long term rotations.

- The ratio rallied quickly after being first shown but then pulled back through most of December
- Since the turn of the year, the ratio has made a new high
Example stocks versus IACI
Example stocks were shown in the first example from the consumer staples sector. There is good commonality for ratio charts across the consumer staples sector against IACI. Conclusion These long term rotation charts are more suited to fund managers making long term allocation and weighting decisions. For a short term trader, they do not provide a defined entry method. Ongoing trades The current trade of SPDR Financials (XLF) v SPDR Energy (XLE) has a 2.1% gain. The stop loss is moved to break even.
Leave a Comment
