Are gold stocks oversold on breadth?
10 December
With the Metastock charting software add-on FIRE, I can create breadth indicators on any group of stocks. With the Philadelphia Gold & Silver Index (XAU) having fallen 17% since 21 September, I looked at whether breadth indicators are oversold.
The XAU has 16 components and breadth indicators were calculated on these stocks. That is quite small for a breadth group but going beyond this does not improve the correlation between breadth and the index. You then include some very small and ill companies, that show little history of responding positively to a rising gold price or a rising XAU index. XAU and percentage of stocks above their 50 day moving average
Points to note
- The %age of stocks above their 50 day moving average is currently zero, an oversold breadth reading
- Breadth at zero marked good buying points many times in the last two years. Dates marked 1, 2, 3, 6 and 7 all picked out lows
- Date 4 gave a two week wait for the low, whereas date 8 only marked a temporary reprieve
- At date 5, breadth reached zero and then stayed low, whilst XAU fell for another two months, until zero breadth was recorded again at date 6
The 50 day breadth often picks out good buying points but occasionally, low breadth is maintained and price continues lower.
Calculating breadth on a longer moving average gives fewer extreme readings. XAU and percentage of stocks above their 200 day moving average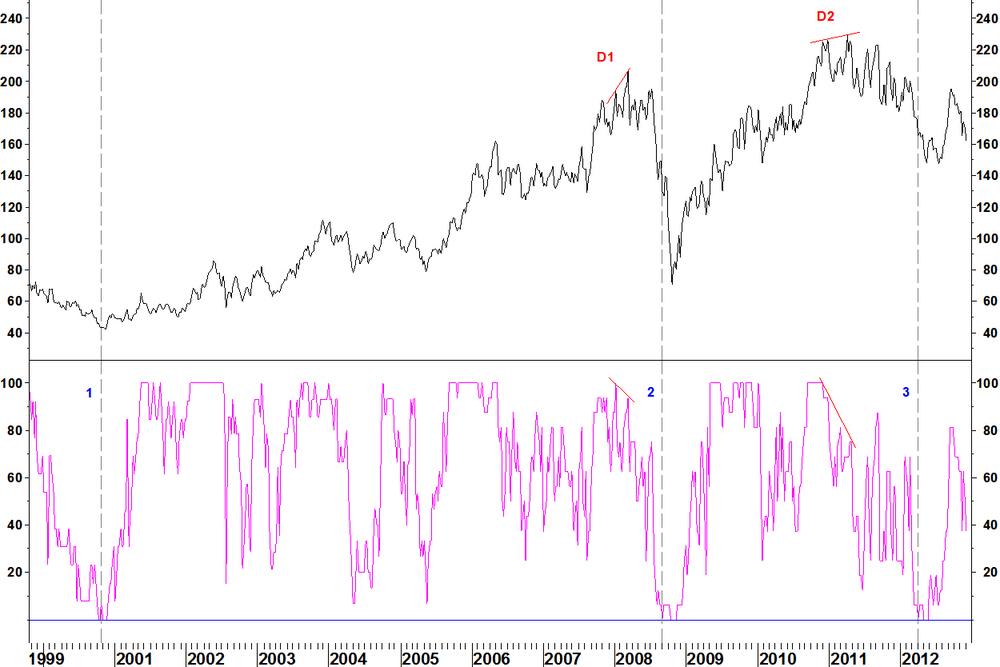
The percentage of stocks above their 200 day moving average has only reached zero in three periods since 1999.
1 At the long term low for XAU, in late 19992 During the 2008 crash
3 During spring 2012 Points to note
- A 200 day moving average breadth reading of zero has led to a good buying opportunity all three times
- Each time, breadth remains low for a month or two and price falls further
- The continued decline was modest in 1999, large in 2008 and in 2012, somewhere in between at 10.6%
- Breadth divergences mark peaks in March 2008 (D1) and April 2011 (D2)
- Breadth is now mid range at 37.5%
Current situation
The 50 day breadth indicator is oversold, so there may be a bounce from here, which could have started today. With longer term breadth mid range, this is not a reliable long term low. There is always the risk that low short term breadth is maintained, like with date 5 on the first chart. Combining breadth with other indicators When a long term breadth low is reached, you can turn to other indicators to pick a low on stocks. My turn picking indicator is to look for weekly RSI divergences. This bit is hindsight analysis but it demonstrates the point. Pan American Silver (PAAS)
- In late July 2012, a bullish weekly RSI divergence is formed on PAAS, coinciding with a MACD divergence
- The daily chart of PAAS also has a bullish RSI divergence against the May low
- This coincides with date 7 on the 50 day breadth chart, a move down to zero breadth
- 200 day breadth had moved off zero but was still low at 12.5% (2 stocks out of 16 above their 200 day moving average)
- This combination provides a good, low risk, high reward entry on PAAS
Current situation
No gold stocks show weekly RSI divergence set ups. RSI values are mostly mid range, tying in with the 200 day sector breadth being mid range. Wait for a clearer opportunity for a good trade on gold stocks.
Leave a Comment
