How does market breadth vary by capitalisation size?
25 June
Pinnacle Data Corp provide breadth data for eight market capitalisation segments. These are: NASDAQ 100 IndexRussell 1000 Index (large cap)
Russell 2000 Index (small cap)
Russell 3000 Index (the two above combined)
S&P 100 Index (100 largest cap stocks)
S&P 500 Index (large cap)
S&P 400 Index (mid cap)
S&P 600 Index (small cap) For each segment, the following breadth indicators are available. Actually there are a few more but I’ll focus on these eight: 5 moving average breadth indicators
%age of stocks above their 21 day moving average
%age of stocks above their 50 day moving average
%age of stocks above their 80 day moving average
%age of stocks above their 100 day moving average
%age of stocks above their 200 day moving average 3 cumulative type indicators
Advances minus declines
Advancing volume minus declining volume
New 12 month highs minus new 12 month lows This data is only available from the start of 2008. More history would have been better but it is still useful. How do we judge which indicators are the most useful? I will focus on the cumulative breadth indicators in this blog. The moving average breadth indicators will be in the next blog. For the cumulative indicators, as before:
- Do market tops come with divergences
- Do divergences lead up to market tops
What do the indicators show?
Looking at what each indicator shows tells us something about the divergences (or lack of them) seen in the broad exchange based cumulative breadth indicators. A short history is available but there are still some conclusions on the effectiveness of each indicator. High/low indicators Starting with these, as they have been found the most useful on the exchange based indicators. The large cap breadth indicators (S&P 100, NASDAQ 100, S&P 500, Russell 1000, even the S&P 400) confirm the market index advance. S&P 500 Index and cumulative news highs minus new lows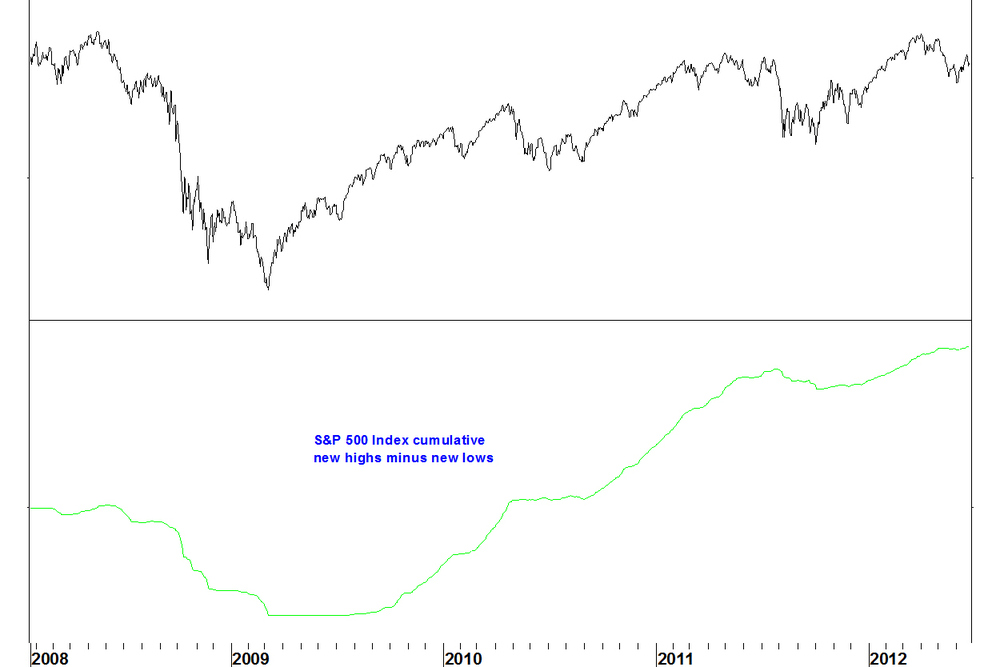
The breadth indicator advances in line with the index.
The small cap breadth indicator makes a lower high, and this is clearer on the Russell 2000 than the S&P 600. Russell 2000 Index and cumulative news highs minus new lows
This is not a divergence against the Russell 2000 Index, as both make lower highs than in 2011. We can say though that the Russell 2000 breadth indicator (and price) do not confirm the advance in the S&P 500 Index.
Advance/decline indicators The conclusion is the same for the advance/decline indicators. Notice that these are choppy charts whereas the high/low charts are smooth lines. S&P 100 Index and cumulative advances minus declines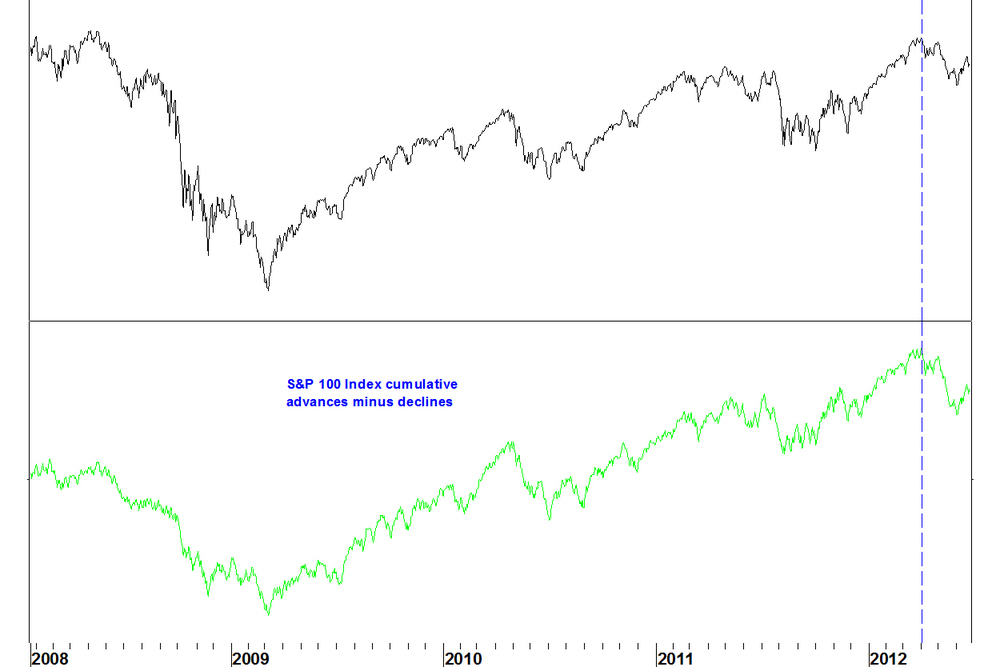
Advancing volume/declining volume indicators
These indicators are the least useful. On the large cap indices, these showed a divergence in 2011 but this did not play out. NASDAQ 100 and cumulative advancing volume minus declining volume
The divergence in 2011 did not play out, so why take notice of the current divergence?
Conclusions- The highs/lows and advance/decline indicators have forecasting value but the volume indicator does not
- The fact that divergences only appear on the small cap indices supports the idea that the difference between the broad NASDAQ and NYSE indicators is due to foreign bodies (bond funds) distorting the NYSE cumulative breadth indicators
- This supports the idea that the broad NASDAQ highs/lows indicator is the one to follow most closely. It shows a divergence.
Further points to note
- It would be hard to have a NASDAQ breadth divergence without the small stocks contributing to this anyway, as there are so many more of them
- We can’t (from this data at least) see how the other capitalisation sizes behaved at the last market top. I can, using FIRE, build custom stock groups to examine breadth indicators over a longer period. These will be on static stock groups, not accounting for index membership changes.
Leave a Comment
