Weekly breadth data: how does it differ and what does it tell us?
25 June
Also available from Pinnacle Data Corp are weekly breadth series on the NYSE, NASDAQ and AMEX exchanges. Weekly breadth data shows the number of advances, declines, highs, lows etc over the week rather than for five separate days. For example, there could be four small up days and one large down day in a week, down enough to make it a down week. The daily cumulative breadth total would be +3 but the weekly total would be -1. The rationale for weekly series is that a Friday closing price is more important than a mid week closing price. If a move holds by the end of the week, it is more noteworthy. This data is available since 1981 (1986 for NASDAQ weekly highs/lows). The volume data only is available for the NYSE but has recently become very erratic. So there are six series to focus on. What is the predictive record of this data? Predictive record of weekly cumulative breadth data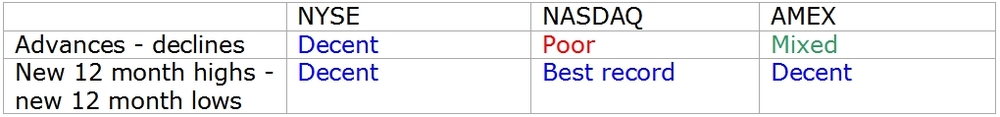
There are some differences in what this data shows compared with the daily data. The current situations of these indicators are contradictory.
- The NASDAQ highs/ lows series has the best predictive record and so the state of this indicator is the most important factor. Like the daily series, this shows a divergence
- Countering this, the NYSE and AMEX advance/ decline series, which have decent and mixed records respectively are still positive. There is no divergence
Conclusion
The weekly series do not offer us a great deal different to the daily series. Whilst it is good to see the NASDAQ highs/ lows series tell the same story as the daily series, if something is not standing out clearly, it is best to move on to something else. In the next blog, I’ll look at the breadth indicators for the different capitalisation size market segments. That will give some insight into the reasons why these exchange based indicators behave differently.
Leave a Comment
