Week 2 of the makings of a customisable package of breadth indicators and commentary
Moving average breadth indicators for market cap stock indices
02 July
Following on from last week, I’ll show what moving average breadth indicators from Pinnacle Data Corp reveal. To recap, moving average breadth indicators show the percentage of stocks above a moving average. These indicators are helpful when:- There is a track record of forming divergences at turning points
- Overbought and oversold levels remain fairly constant over time, allowing us to predict at least a pause in the market’s trend
This is not true for all the indicator series. What I show you can be filtered for those with decent predictive track records and then showing them at particularly important times.
There are five indicators calculated over eight market cap segments. They are: NASDAQ 100 IndexRussell 1000 Index (large cap)
Russell 2000 Index (small cap)
Russell 3000 Index (the two above combined)
S&P 100 Index (100 largest cap stocks)
S&P 500 Index (large cap)
S&P 400 Index (mid cap)
S&P 600 Index (small cap) For each segment, the following breadth indicators are available: %age of stocks above their 21 day moving average
%age of stocks above their 50 day moving average
%age of stocks above their 80 day moving average
%age of stocks above their 100 day moving average
%age of stocks above their 200 day moving average Here are some examples of how the data looks and when it is most useful.
S&P 600 Small Cap Index and %age above 200 day average
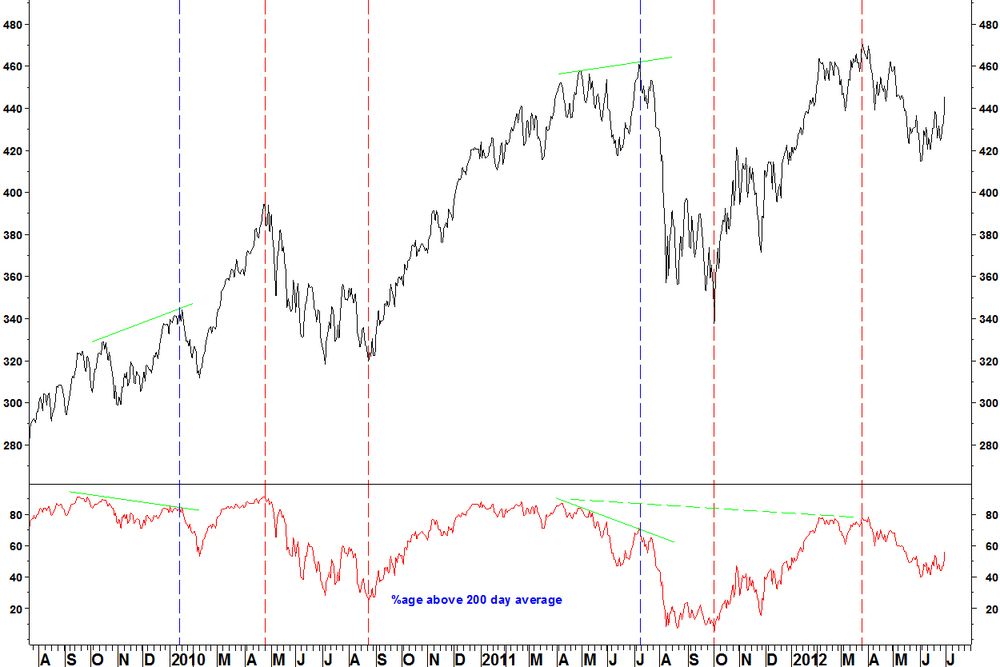
- In January 2010, a divergence on the indicator, developed since the previous September, marks a high
- In April 2010, the index high is marked by high breadth but no divergence
- In August 2010, the low is marked by breadth similar to that at the July low but no divergence
- In July 2011, the high is marked by a divergence. This is the clearest signal on the chart because the divergence is large (from 87% down to 71% at the high)
- In October 2011, the low is marked by low breadth but no divergence
- In March 2012, the high is marked by breadth level with February. There is no divergence within 2012 but a longer divergence against the 2011 high
- Now, the breadth is mid range. If a new high was made, it could be formed on a divergence, which would be a signal to get out. The indicator has not reached oversold
NASDAQ 100 Index and %age above 21 day average
The situation on the 200 day breadth is similar for the NASDAQ 100, in that the best signal is a breadth divergence at the July 2011 high. Confirmation across the different cap sizes market segments strengthens any conclusions that can be drawn.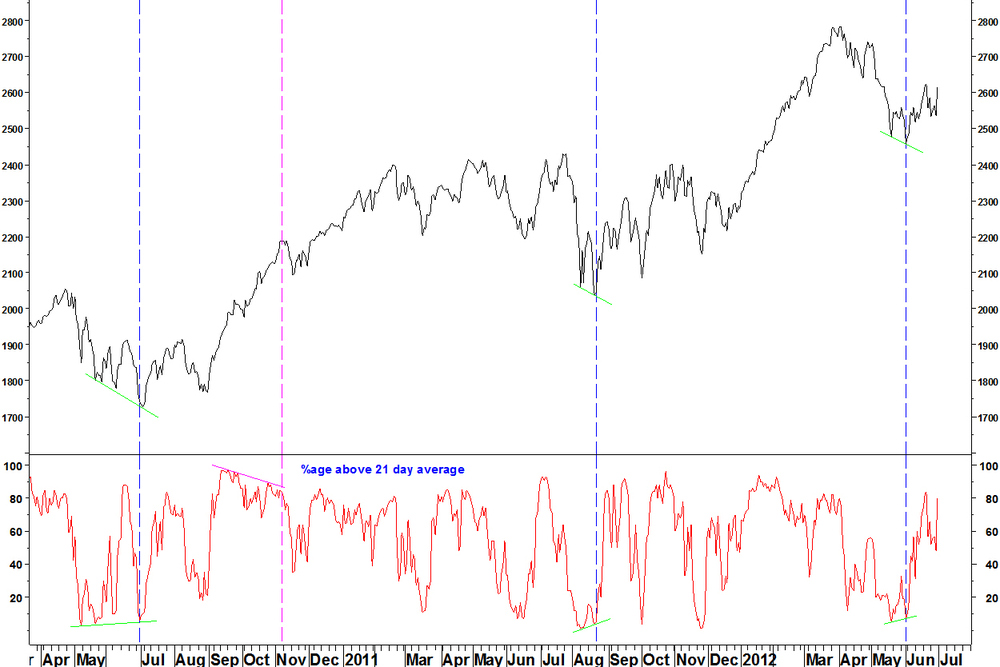
- The shorter term breadth indicator is better used for picking short term lows through divergences, whilst the indicator is at the bottom of the range. Three such examples are shown: July 2010, August 2011 and early June 2012
- Context from the longer term breadth indicators is needed but even in the 2008 crash, this tactic works reasonably
- This indictor works less well for picking tops. Much of autumn 2010 is spent on a divergence but the index continues higher. The November setback is shallow as the longer term breadth indicators are not on divergences
S&P 500 Index and %age above 50 day average
The idea of an indicator showing the same thing over different market segments was useful at the October 2011 low.

- The S&P 500 Index formed a low with a bullish divergence on the 50 period breadth indicator
- There were also divergences for the S&P 100 Index and S&P 400 Index (mega and mid cap indices)
- Divergences in spring 2012 took a long time to play out, as the longer period indicators were not overbought and divergent
Summary
- Divergences are the best situation for picking turns, the more marked the better but they don’t come around that often
- High breadth is no guarantee of a peak and low breadth is no guarantee of a trough
- Short period moving average breadth indicators are more useful at lows than at highs
- These indicators are to be used in conjunction with other ideas, particularly RSI divergences

Trackbacks & Pingbacks