Simple Simon: Can RSI divergences make you look foolish?
21 May
Here is an example of an RSI divergence trade on a real estate pair.
These trade types are quite difficult to take on because on another time frame (say a monthly chart) they appear to be going straight up, or, against another ETF, the divergence isn’t set up correctly. Nevertheless, I’ll show the set up, which is almost complete and you can judge it.
The pair is Simon Property Group (SPG) v iShares Real Estate (IYR). SPG is the biggest component of IYR.
Weekly chart
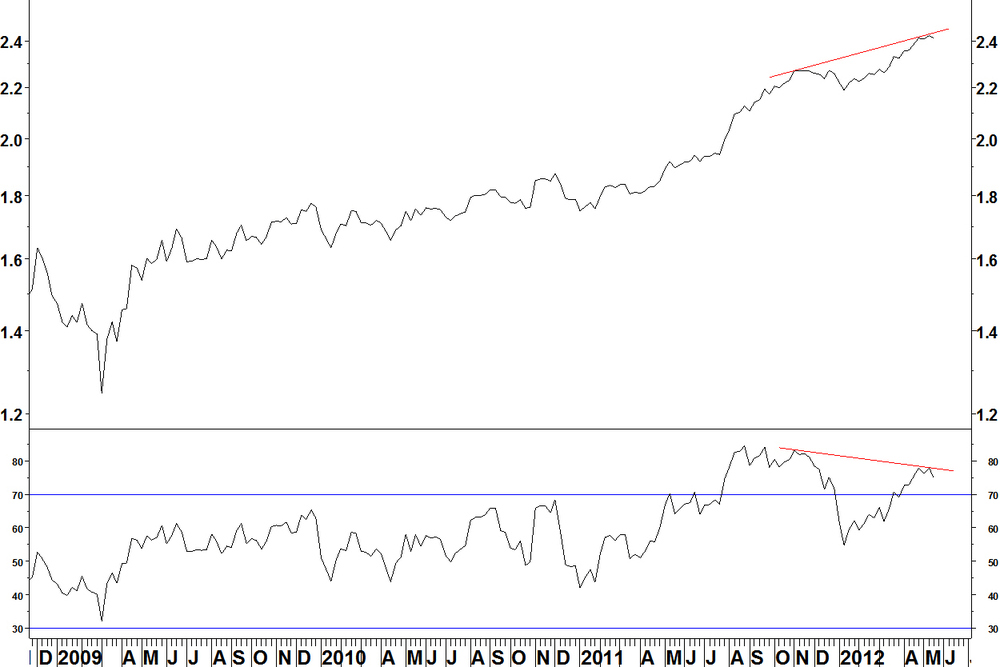
- The weekly chart shows a long term uptrend but an RSI divergence against the 2011 high
- There is also a MACD divergence
Daily chart
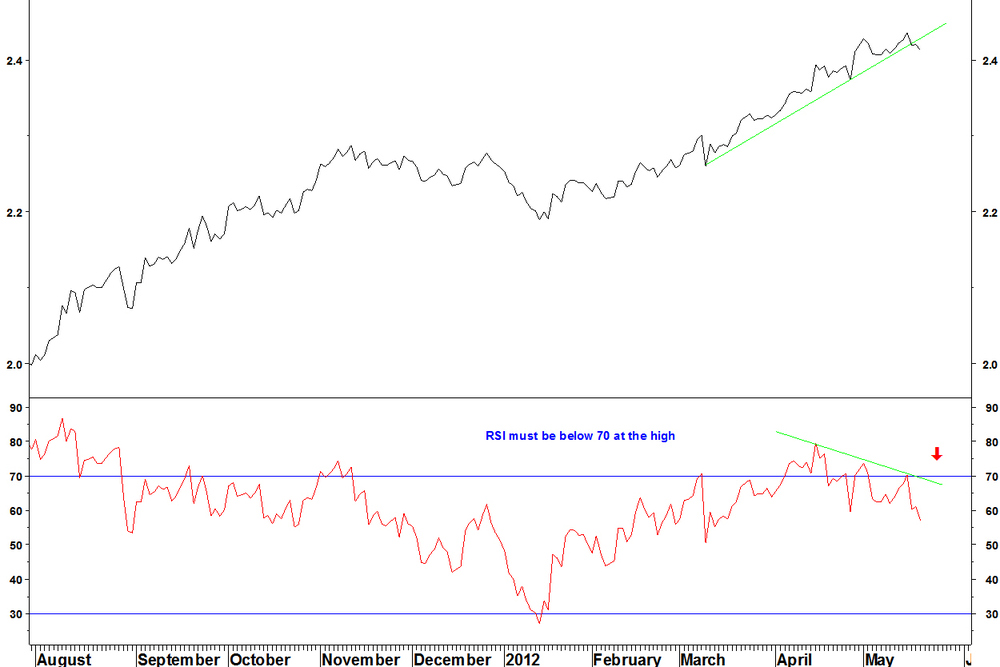
- The daily chart shows the 01 May divergence failed to hold the advance
- Another divergence formed on 15 May, still above 70
- The requirement is a new high with a daily RSI divergence below 70. That has yet to form
- If it does form, a formation break can be taken as an entry signal, a break below the last low, with a stop above the high
At the very least, this event could trigger you to rebalance a real estate portfolio back to neutrally weighted in SPG. It might turn into a good pair trade or it could just go sideways for a while and unwind the divergence.
Tell me what you think of these RSI divergence trades. Do you think they are just trying to pick exact tops and bottoms or do you think the entry criteria are specific and important enough to matter? I’ve seen so many important turning points marked in this way but I admit that divergences have potential to continue before they kick in.
Trackbacks & Pingbacks