U.S. Natural Gas and related stocks
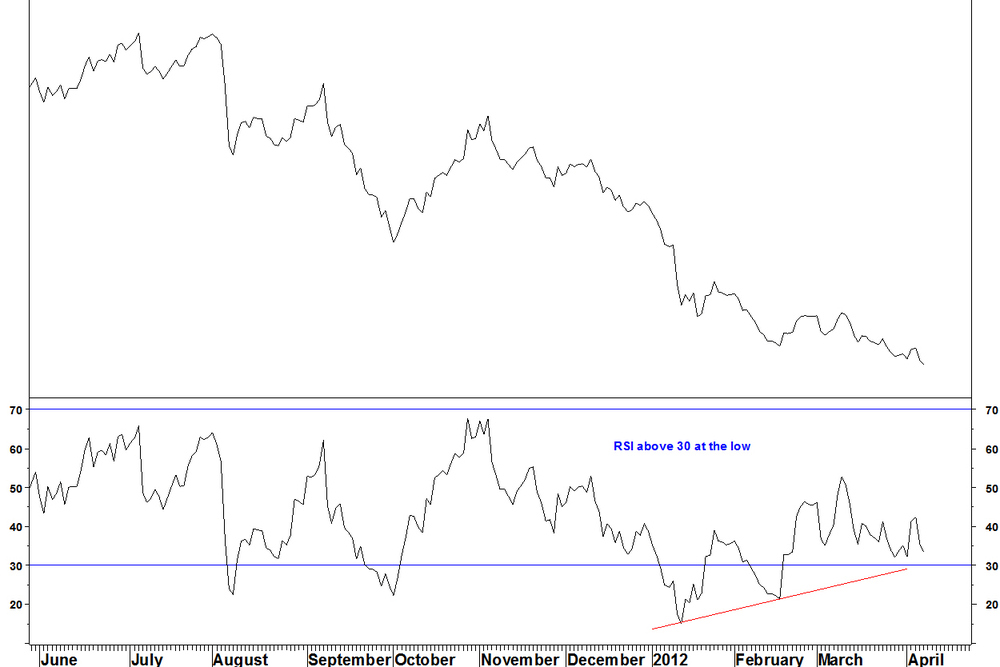
U.S traded Natural Gas has halved since summer 2011 but the latest decline gives it a bullish divergence on the 14 week RSI, just as in May 2009.

Daily chart

- The end of March low is a divergence against the January low (albeit fractionally above 30 – not quite meeting the stated criteria)
- The last low of 05 April has RSI above 30
The reason for the low price is the mild winter and the record levels in storage. The fundamental reasons why the price could rally are stated in this article by David Fessler.
I will focus on the relative strength of Natural Gas stocks rather than price.
National Fuel Gas Co. (NFG) versus the S&P 500 Index
This stock has a range of operations, it is mainly a utility but also is a gas producer (I prefer to call it an extractor). More importantly, it meets the RSI divergence criteria.

- On the weekly chart, the stock versus S&P 500 Index is on its second bullish RSI divergence
- It has not yet given a buy signal of a move above the previous RSI high or a weekly reversal
Daily chart
- The first weekly divergence of mid February did not meet the criteria for the daily RSI: RSI above 30 after a divergence that failed to hold the decline
- The current divergence meets these criteria
- So we wait for the entry criteria of the weekly RSI going above the intervening (09 March) high
- At your discretion, you can take a decisive break of the relative downtrend and rally from the low, with the 09 March RSI high being broken.
- Looser criteria means more trades and closer stop losses but slightly higher chance of a false signal
Cimarex Energy (XEC) versus the S&P 500 Index
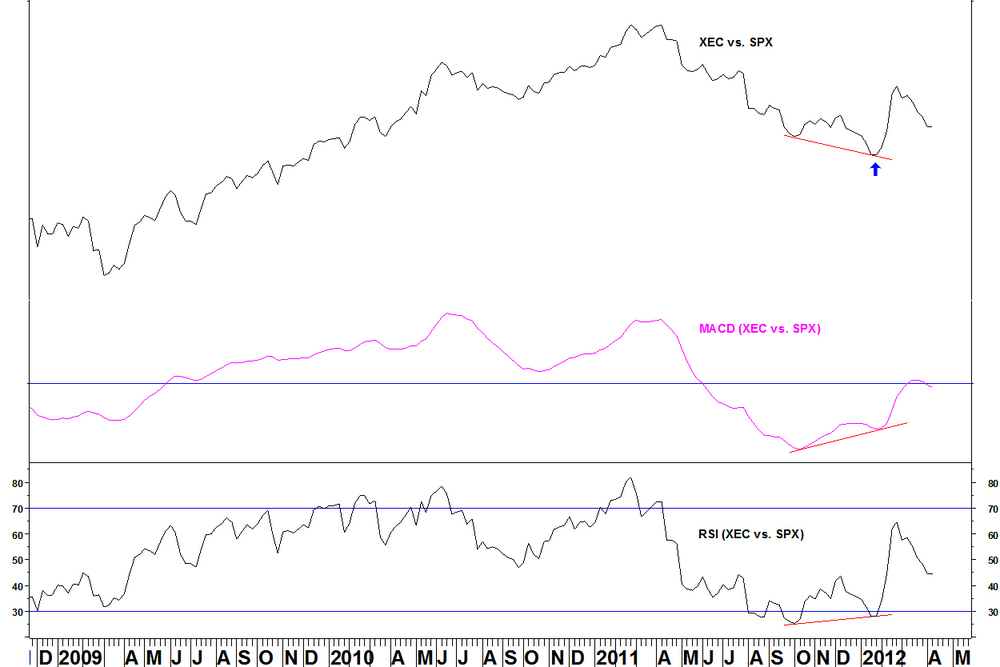
The ratio had bullish divergences on its weekly RSI and MACD at the January low.
Daily chart

On the daily chart, there were three RSI divergences that failed to hold and the eventual low in late January came with RSI above 30. This serves partly as an example of a trade that matched the RSI divergence criteria, but what about now?
There has been a pullback, which may be another entry opportunity. Large moves rarely happen in one go, so we can watch for a short term relative base to develop. Then, on a move higher, set a stop below that base for a pairs trade.
Other stocks which may meet the RSI divergence criteria (versus S&P 500 Index) soon are:
Apache (APA)
Atmos Energy (ATO)
Bill Barrett (BBG)
Chesapeake Energy (CHK)
Encana (ECA)
GMX Resources (GMXR)
These stocks on the face of it should be more correlated to the natural gas price than NFG but that is the current example, wait for an entry signal.
I will keep you posted if any of these stocks meet the criteria.
