In early September, I set up some Performance ranking (PR) trades in the materials sector. I opened a short position in International Flavours & Fragrances (IFF) vs SPDR Materials (XLB) on 05 September.
Daily chart
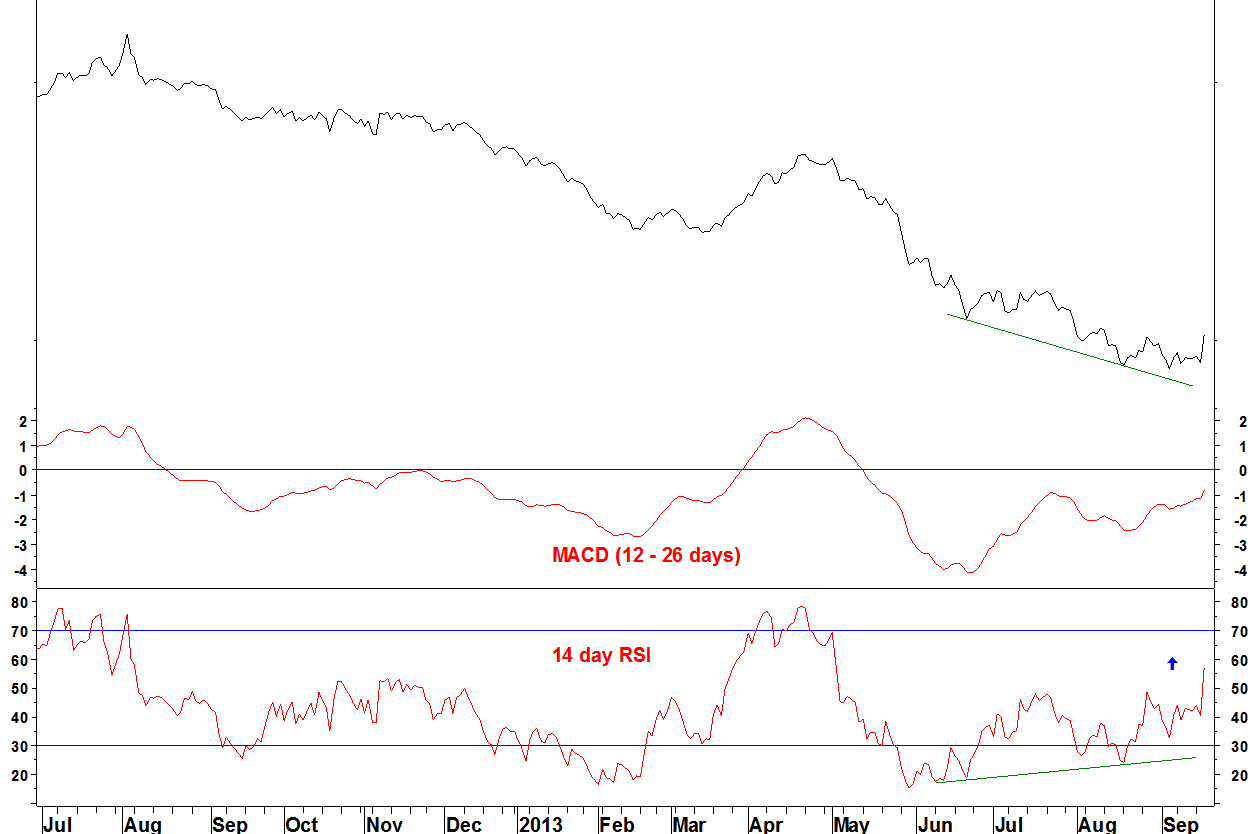
The pair took a month to work off the short term oversold condition but given the longer term RSI and PR divergences, the decline resumed.
There is now a bullish divergence on the 14 day RSI, although no rally yet to say that a low has been reached. The pair has gained 4.7% so far.
I have identified bullish daily RSI divergences as a reason to take profit, but not good enough as an entry criterion – that required weekly divergences.
Therefore, I will take half of the position as profit and move the stop loss to break even.
The short position in Owens Illinios (OI) vs SPDR Materials (XLB) makes modest progress, a 2.3% gain.
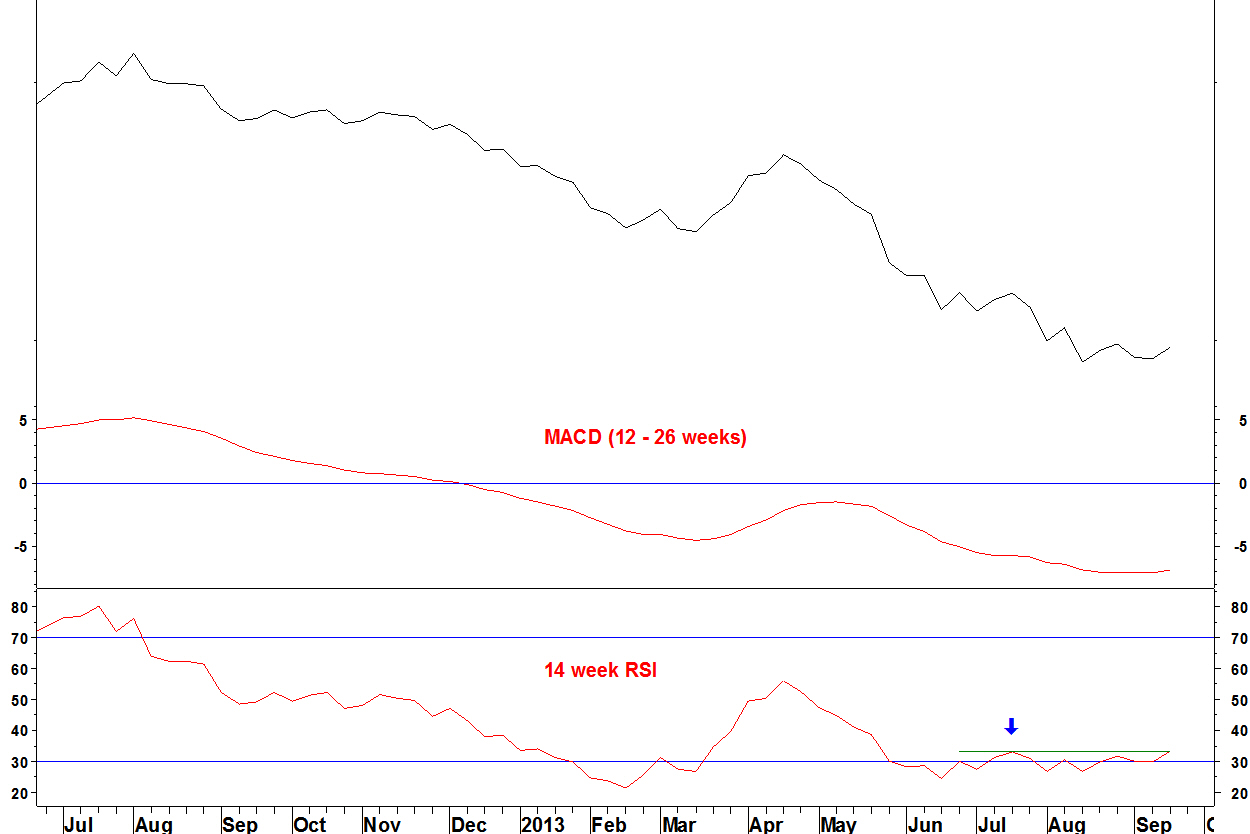
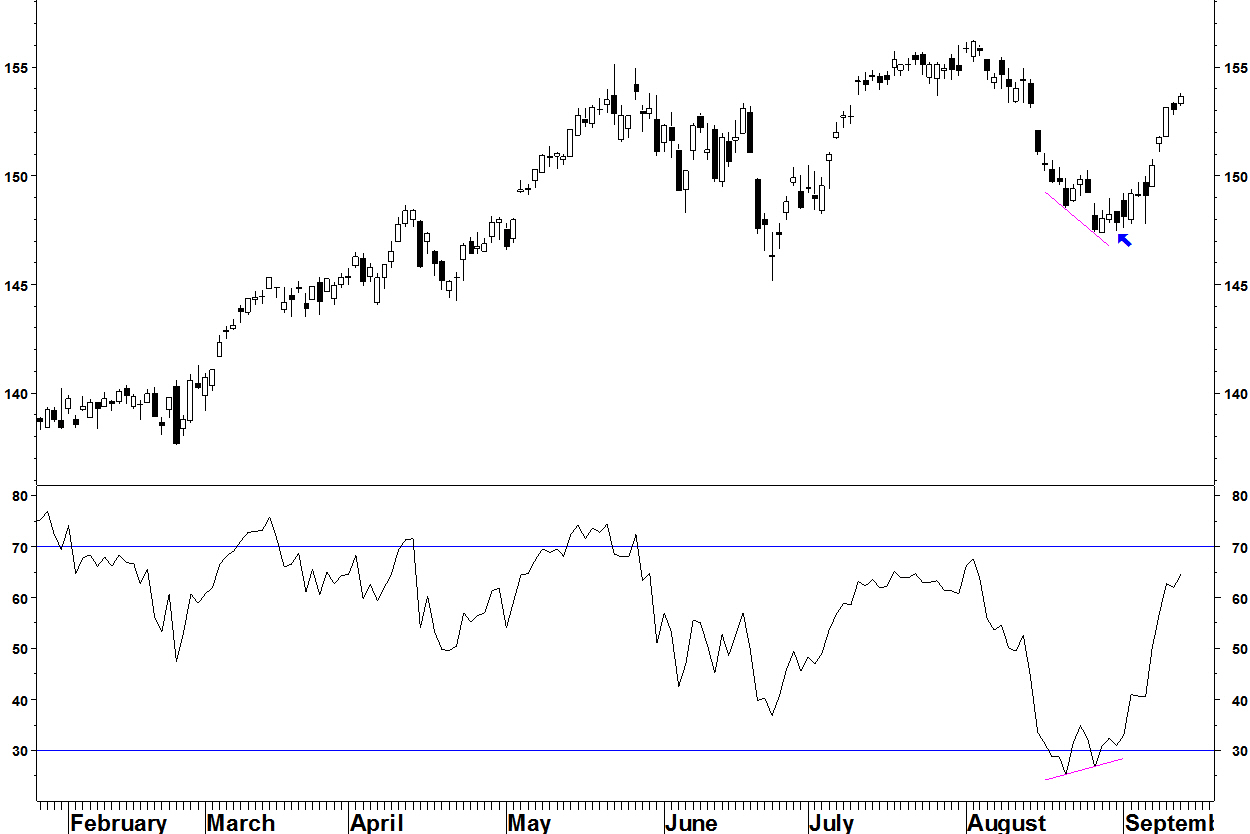
Last week, I showed the chart of Hess Corporation (HES) versus SPDR Energy (XLE) with a bearish divergence on its 14 week RSI and on the Performance Rank (PR) amongst the components of XLE. Here is the updated chart.
Weekly chart

The first of the three criteria I stated last week – a move of the weekly RSI below 70 has happened.
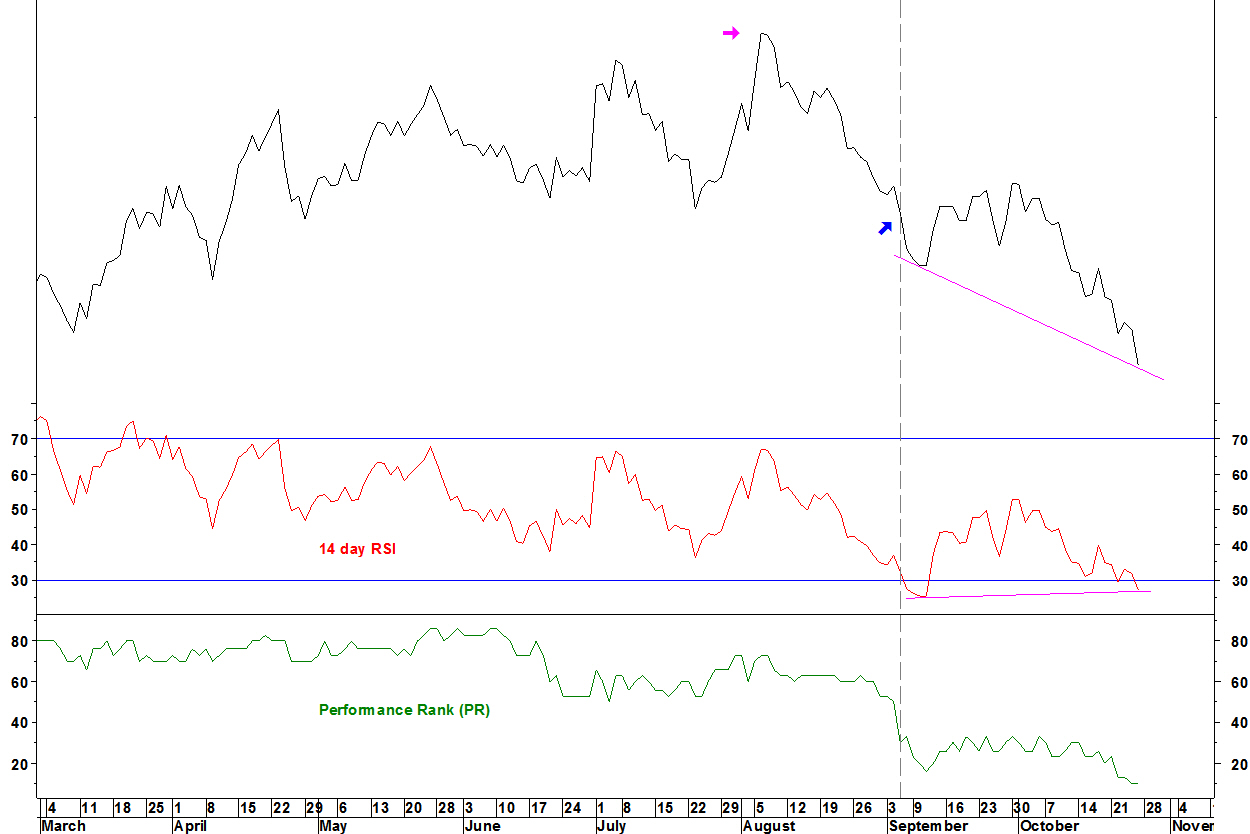
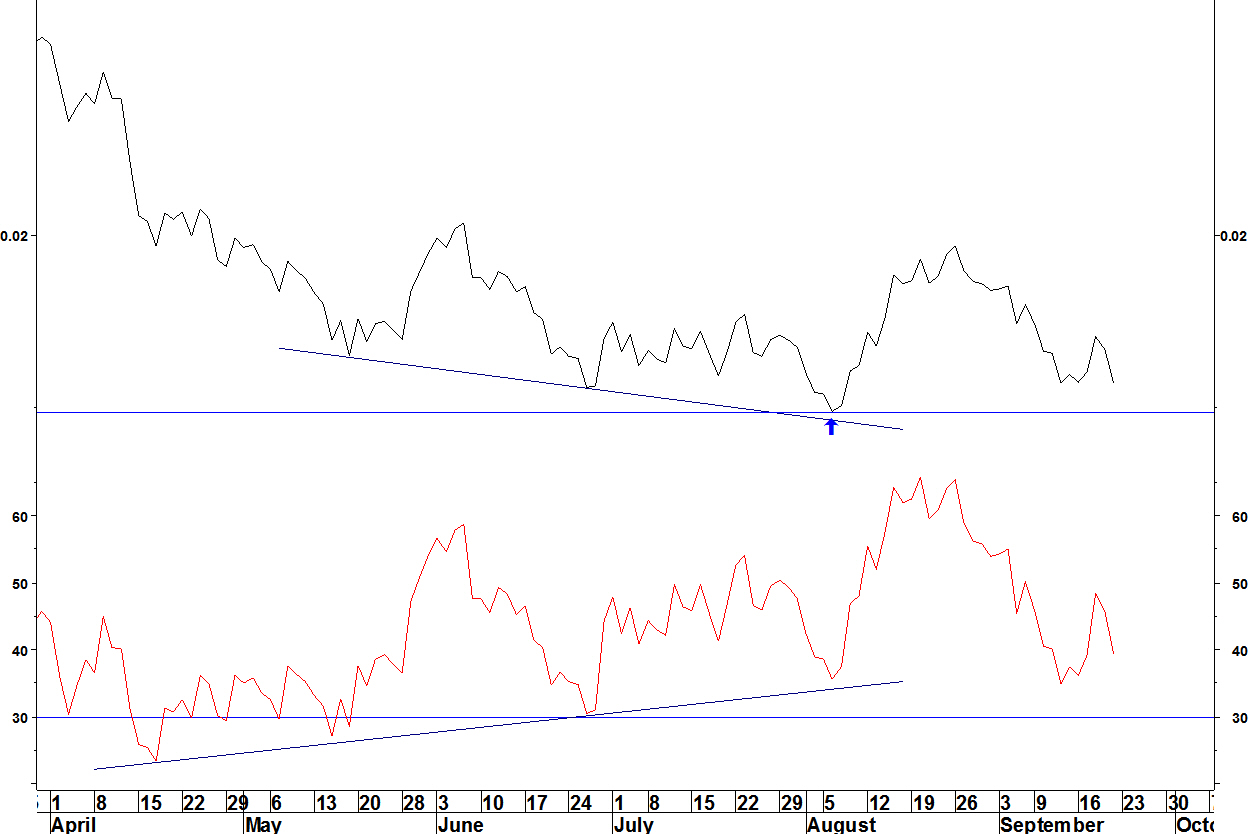
Daily chart

- The second of the criteria has been met – a break of the trendline
- The last criterion is a move to a new 14 day RSI low, below that of 12 September (purple arrow)
- I will add to that, a daily close of the pair below the 15 October low (blue arrow), taking the pair to a new low since 01 October
On those two events, a short position in HES v XLE will be opened, with a stop loss above the 21 October high. That is only 1.5% higher than the 15 October level, so quite tight.
Hess Corporation has an earnings announcement on 30 October. I’d like to get past that before opening a position. Previously, I have opened positions before earnings, then the reaction has negated the entry signal.
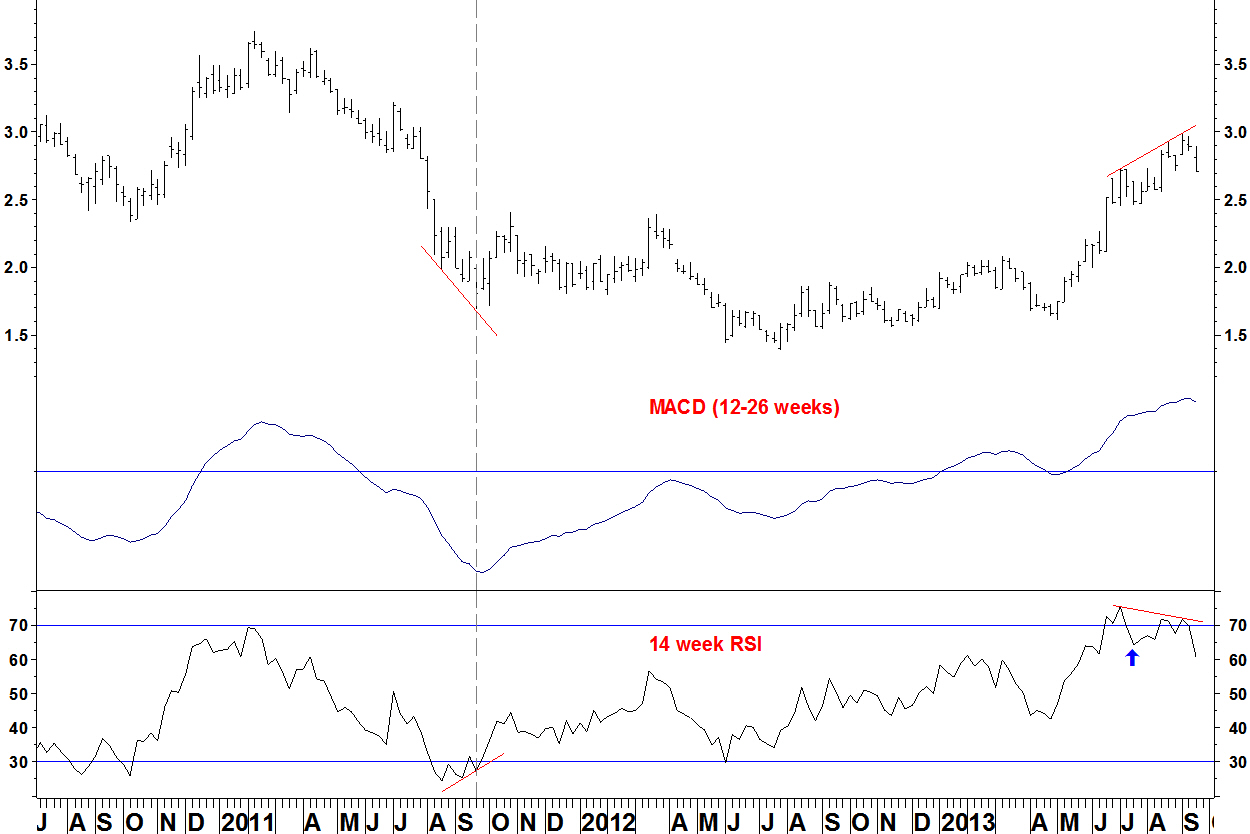
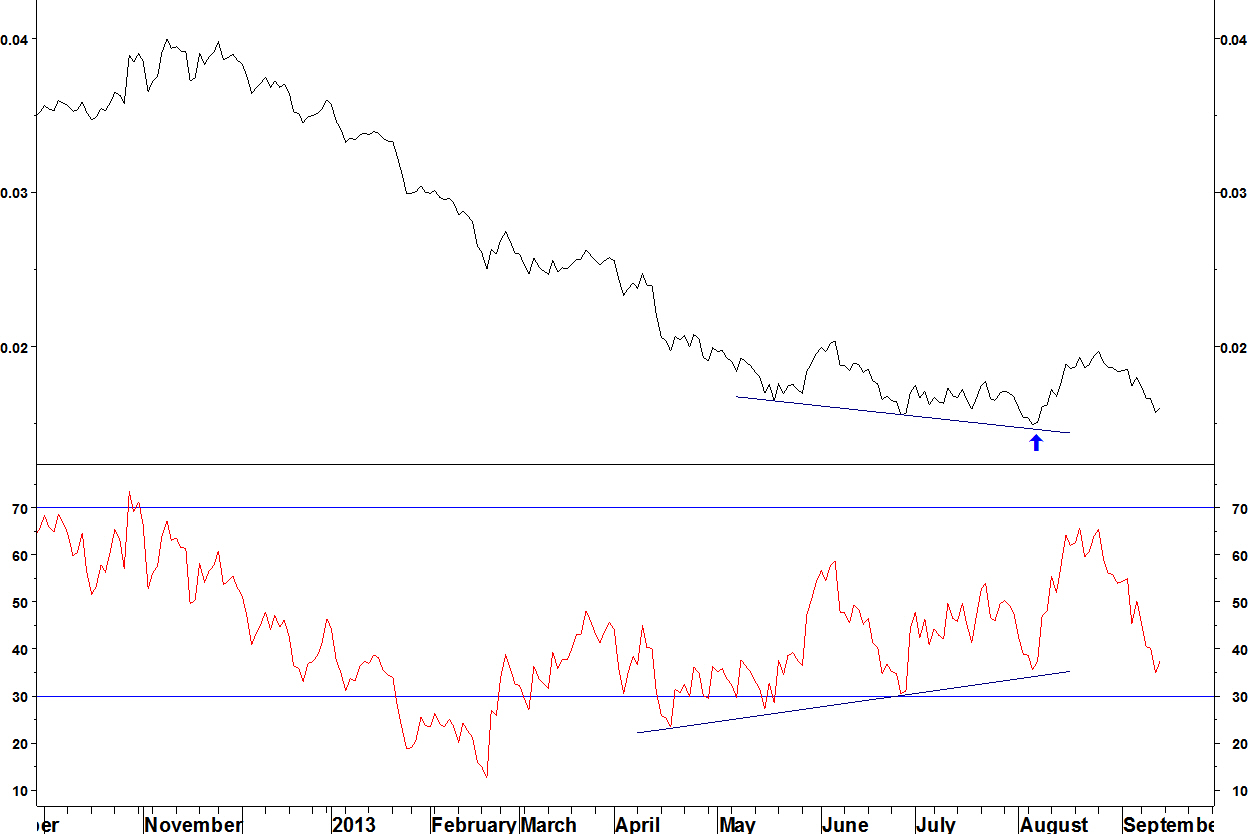
The chart of Hess Corporation (HES) versus SPDR Energy (XLE) has a bearish divergence on its 14 week RSI. The Performance Rank (PR) of HES amongst the components of XLE also has a bearish divergence against its April 2013 high.
Weekly chart
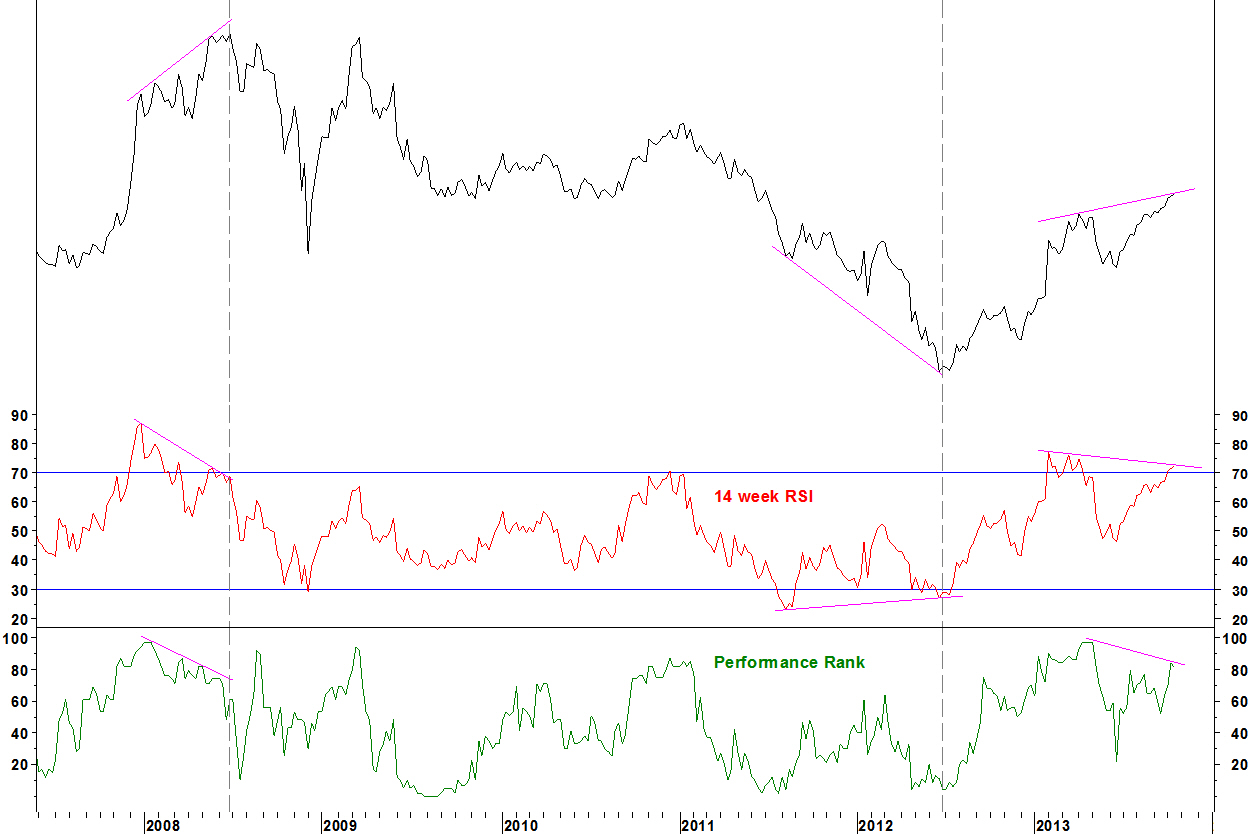
Since 2008, the following set ups have occurred:
- In June 2008, HES v XLE formed bearish divergence on its RSI and PR, then underperformed XLE until December 2008. Crazy times!
- In June 2012, HES v XLE formed a bullish divergence on its RSI at the low. There was no decisive divergence on the PR. A PR divergence can be supporting evidence for the RSI divergence but doesn’t always occur
Daily chart
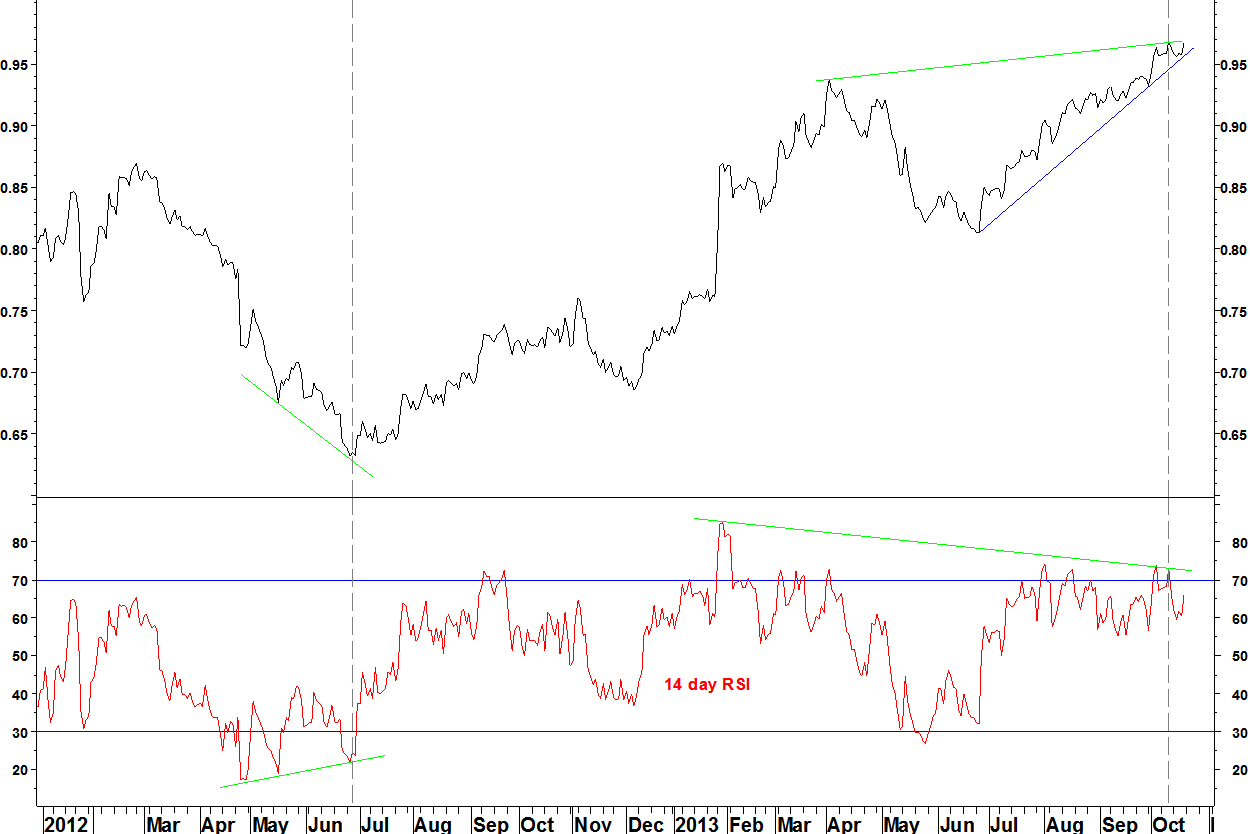
- In June 2012, along with the weekly divergence, there was a daily RSI divergence, although still below 30, not quite matching my ideal daily RSI divergence criteria
- Now, there is divergence on the 14 day RSI against the January 2013 peak. There is fractional divergence against the August 2013 peak
Conclusion
Watch for signs of an end of the outperformance of HES within its sector.
Indications are:
- A move of the weekly RSI below 70
- A break of the trendline on the daily chart
- A move of the daily RSI below the lows since July (55 from 12 September)
A short position in HES v XLE might be opened if these occur. Updates will come via Twitter and on here.
I’m scrapping the long position in Real Estate (IYR) v Broker dealers (IAI). Prices at the time of closing (see Twitter) were: IYR: $66.14, IAI: $33.94, for a loss of 1.5%.
On 23 September, a long position in iShares Real Estate (IYR) v iShares Broker Dealers (IAI) was opened. Today, I closed this as I reconsidered the short side of the trade. Here is why.
Broker Dealers (IAI) v S&P 500 Index (SPX)
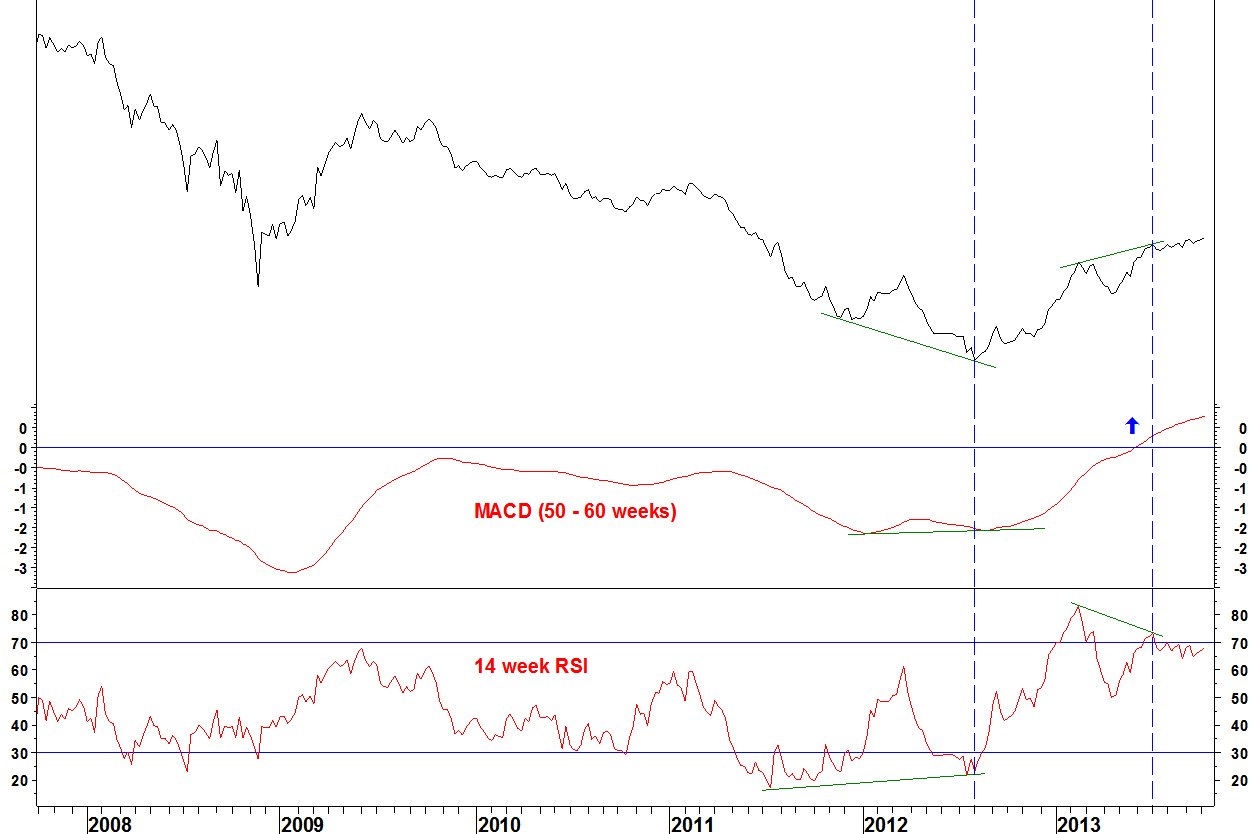
- Whilst there was RSI divergence in July 2013, this has not had an effect. There has been an unwinding instead
- The 50/60 week MACD has crossed above zero for the first time since 2007: a long term moving average crossover. I had overlooked that aspect
- The better RSI divergence was in summer 2012 because
a) It came with MACD divergence
b) The MACD divergence formed after the MACD had been negative for a long time – meeting my moving average crossover trade criteria
- Focusing on the chart of the pair means you can overlook the chart of each component against the market
- Reviewing trades and why they aren’t working is important for improving results
On 02 September, I showed some pairs from the S&P 100 Index. These used RSI divergences and the Performance Ranking (PR) divergence method. I’ll show how these have developed.
Time Warner (TWX) v S&P 100 Index (OEX)
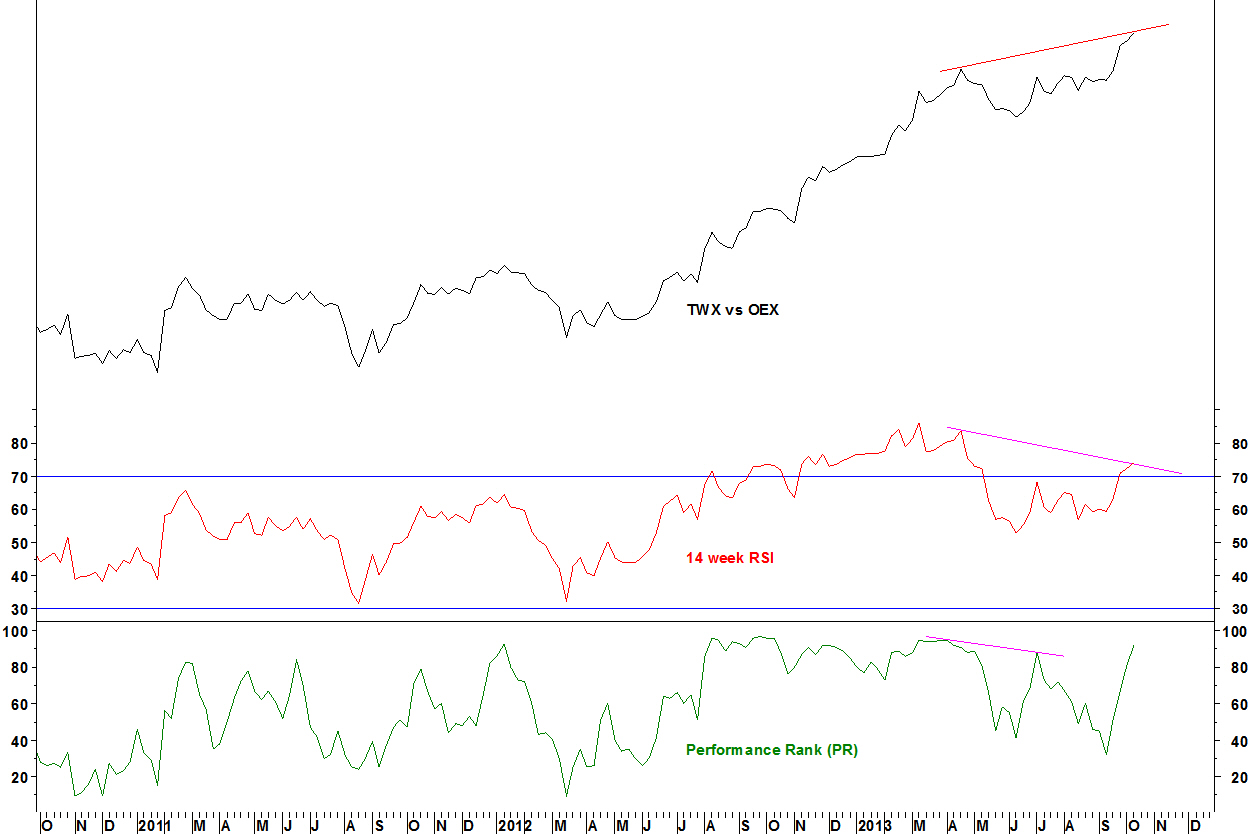
- I showed that with another move higher, the pair would have bearish weekly RSI divergence. That has now happened
- PR divergences can confirm RSI divergences but in this case, the PR for Time Warner (its price performance ranking amongst the S&P 100 stocks) has powered higher, there is no divergence
Daily chart

- There is daily RSI divergence but no PR divergence
Exxon (XOM) v S&P 100 Index (OEX)
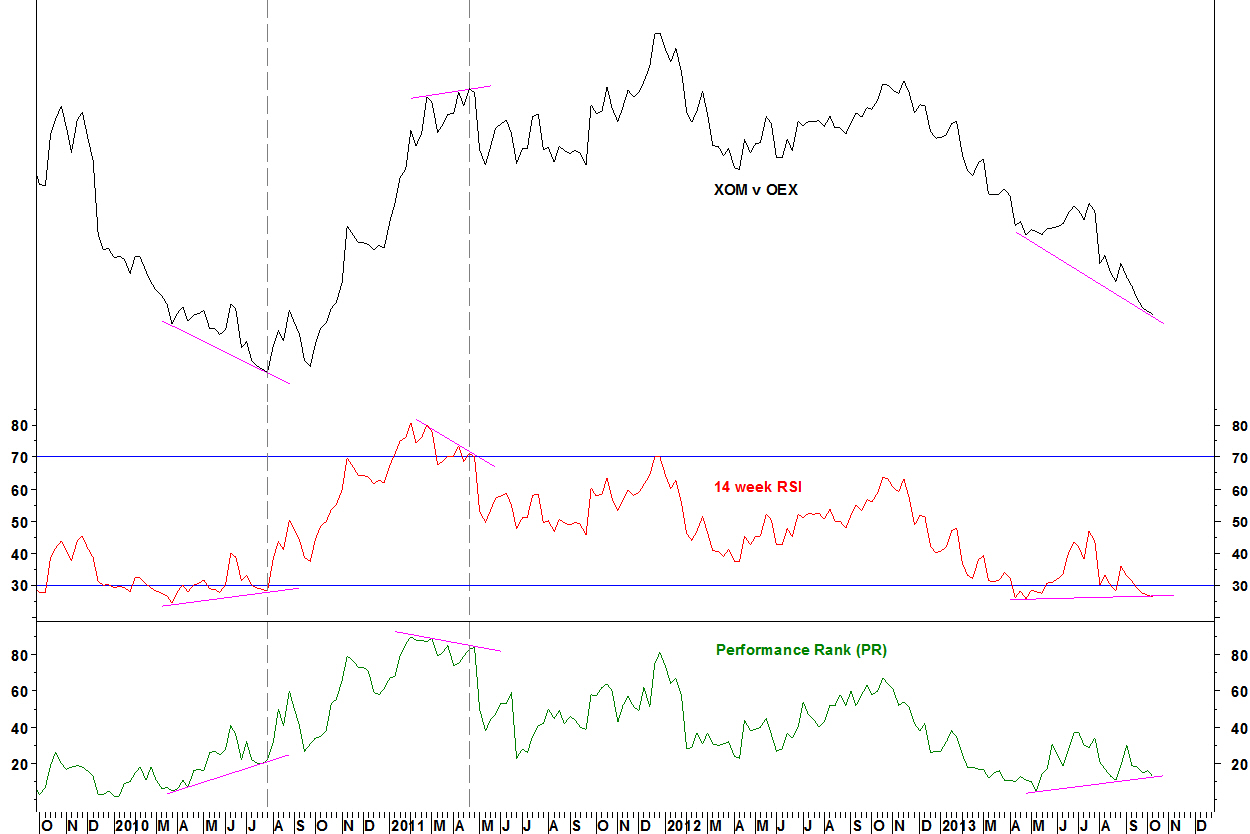
- This has continued lower but there is still a slight RSI divergence against the April low
- The PR has held above its May and August lows, so a slight divergence
Daily chart

- There was an RSI divergence at the 01 October low
- The short term downtrend has been broken
- My ideal daily RSI criteria are a new low with RSI above 30, which has not been met yet
Exxon (XOM) v Time Warner (TWX)
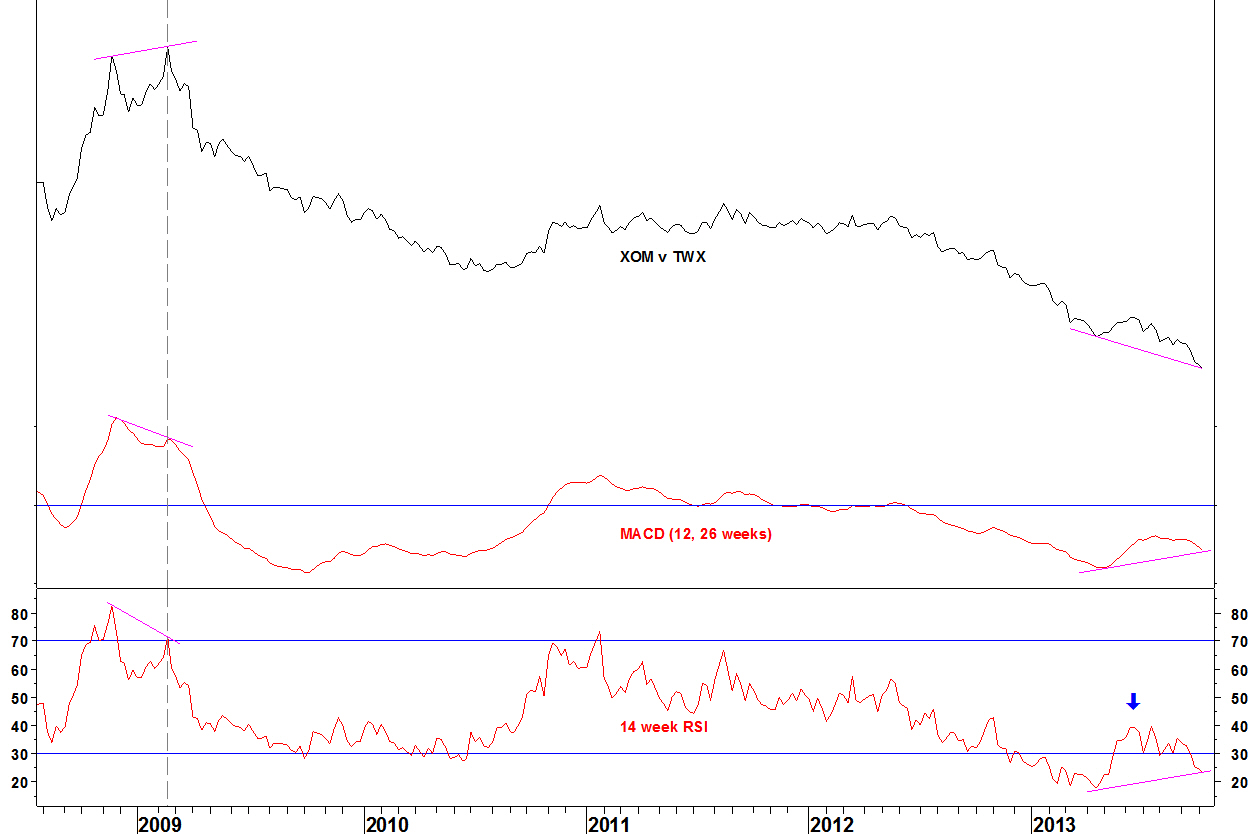
- The weekly MACD and RSI divergences remain in place
- A weekly RSI buy signal would be a move above the intervening RSI high (blue arrow) from June
- That would require a large move and a wide stop loss. Instead, I’ll show the daily chart for a trade set up with a tighter stop loss
Daily chart
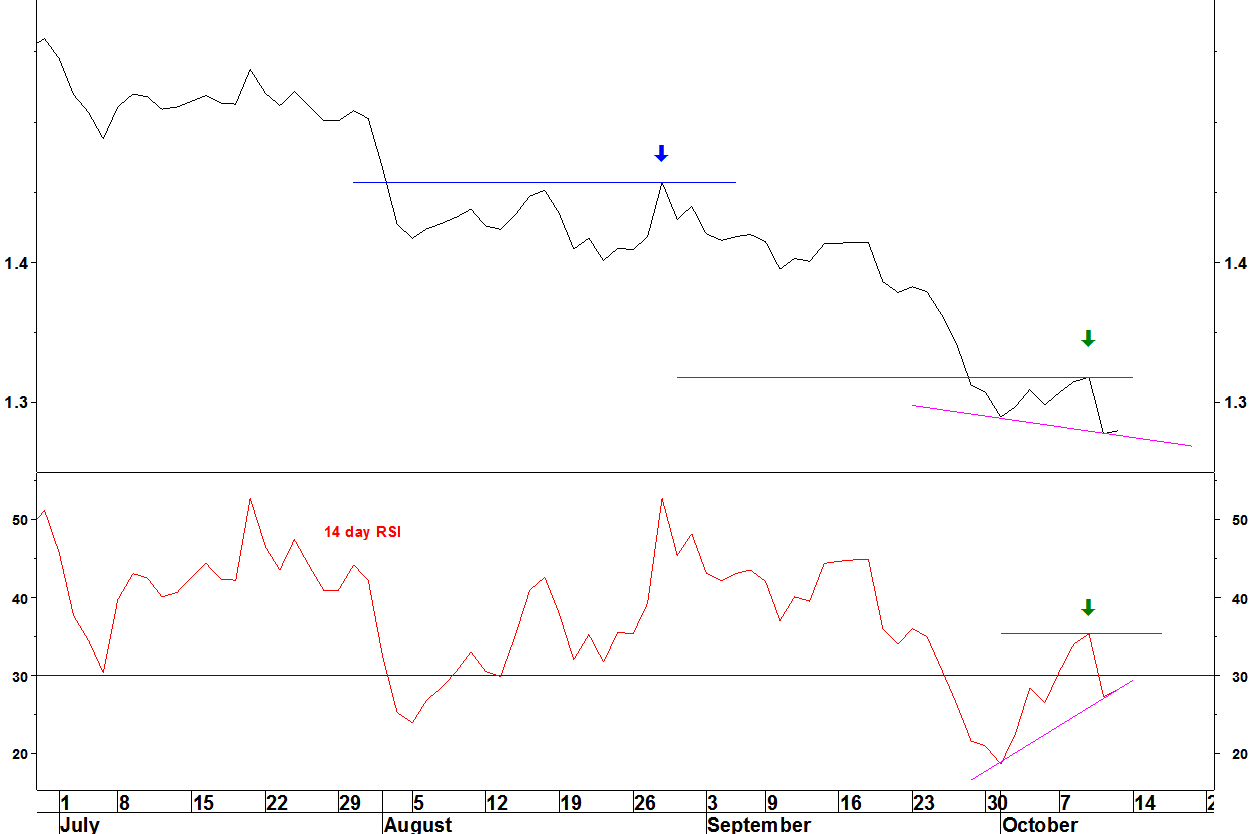
- The original set up of a break above the 28 August high failed to materialise
- There is another daily RSI divergence now, albeit not the absolute ideal scenario of a new low and RSI above 30
- A move above the intervening highs on the ratio and RSI from 09 October (green lines and arrows) is a buy signal
- As it stands, the stop loss of a new low would be 3.0% lower
- If the ratio continues lower, just re-evaluate, no harm done
The trade
This pair and its components against the S&P 100 Index do not have every aspect lined up ideally (PR divergence and daily RSI divergence above 30). They do however have weekly and daily RSI divergences and so this is worth a shot with a tight stop loss.
A long position in Exxon (XOM) v Time Warner (TWX) will be opened on a daily close for pair and daily RSI above the 09 October highs. The stop loss will be a new low.
British American Tobacco (BATS) has been a long term outperformer but that looks about to change.
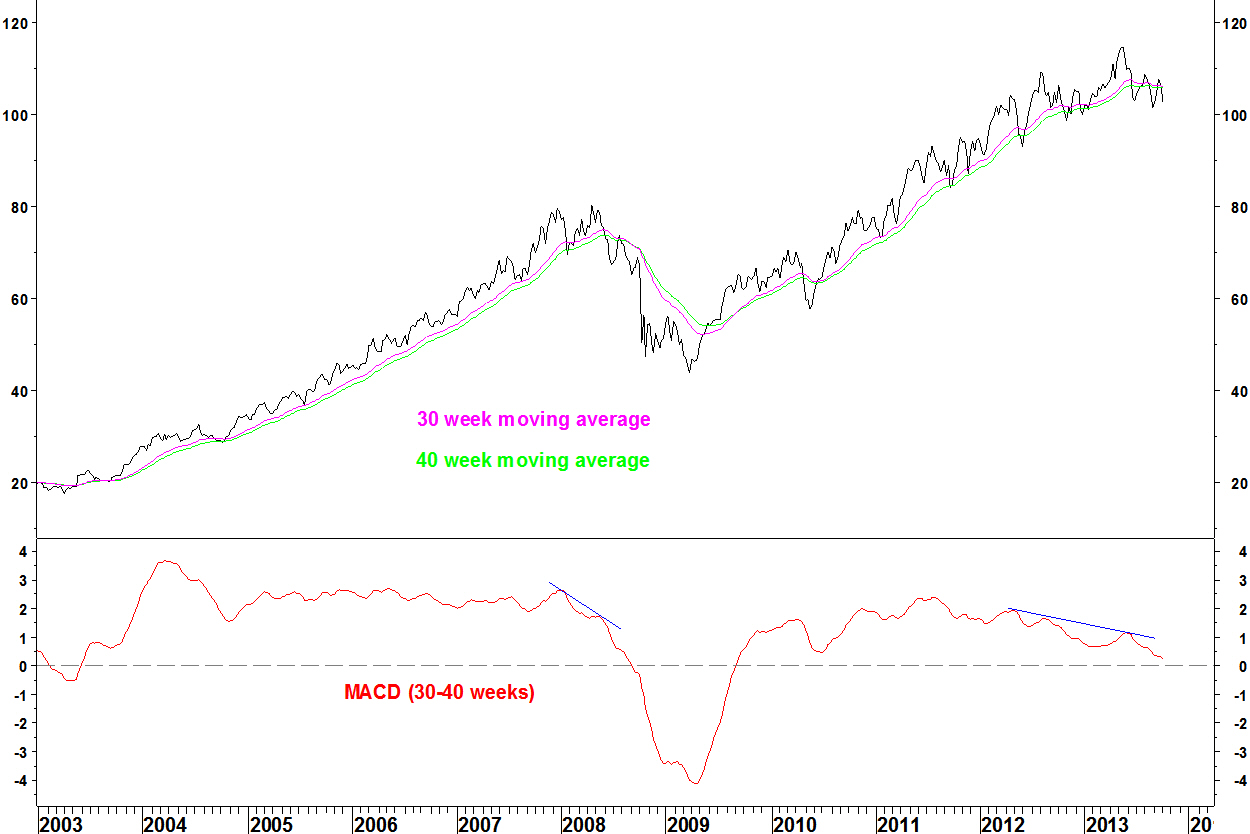
Firstly, on price, BATS hasn’t had a moving average crossover on its 30 and 40 week combination since September 2009 and had MACD divergence at its high (as in 2008). This meets my criteria of looking for series for which the moving averages have not crossed for at least four years. A price crossover looks imminent.
BATS price
Relative to some UK large cap stocks, crossovers have occurred and after an even longer wait.
GlaxoSmithKline (GSK) v BATS
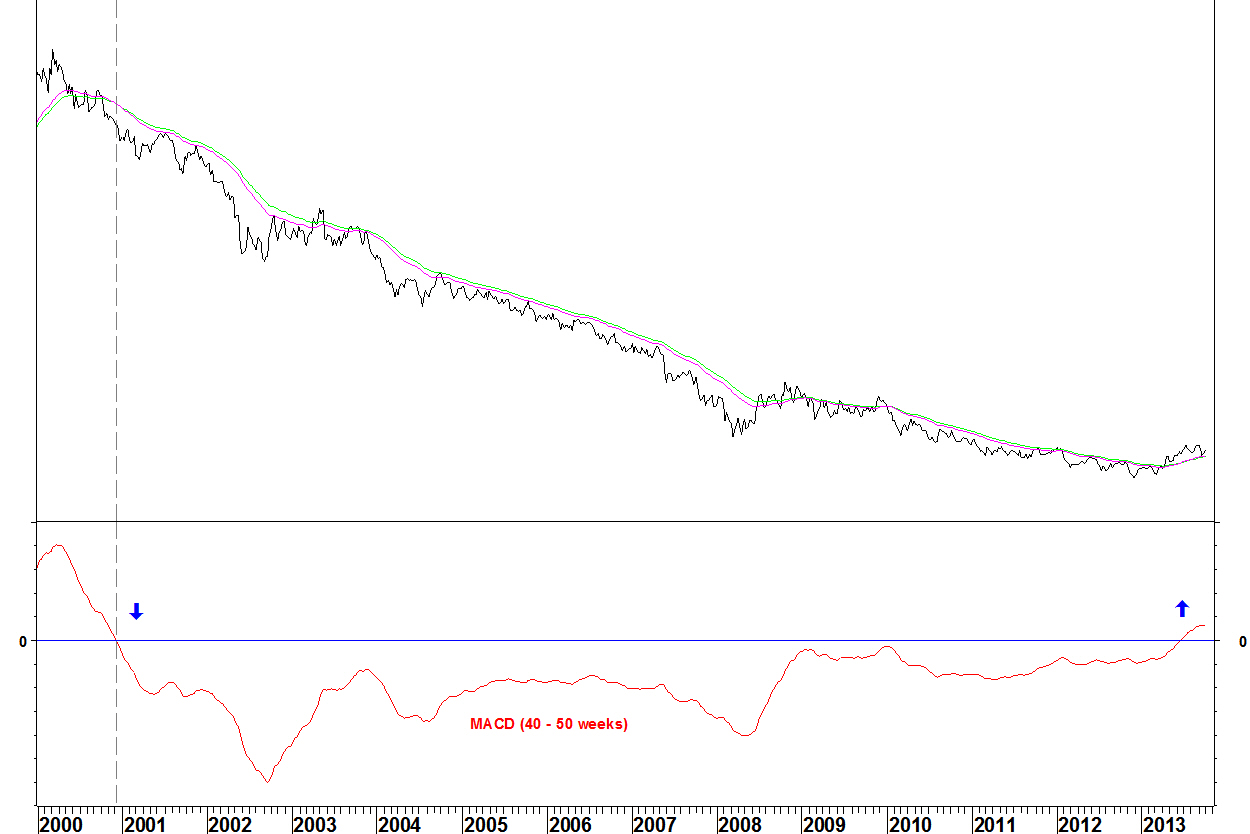
- The 40 and 50 week moving averages crossed in June 2013, having not crossed since December 2000
- There is no hard and fast rule about which moving averages to use. The point is, something has changed for BATS.
HSBC v BATS
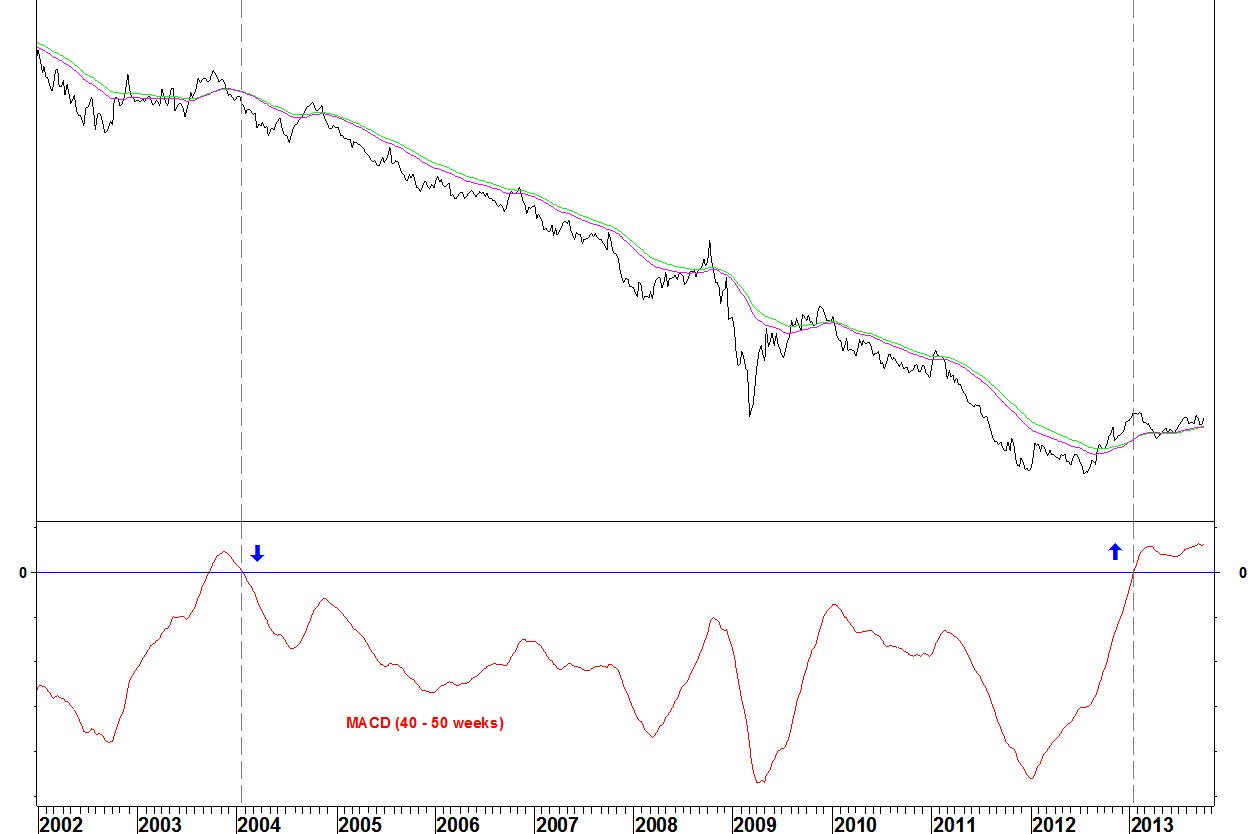
The 40 and 50 week moving averages crossed in January 2013, having not crossed since January 2004
Barclays v BATS
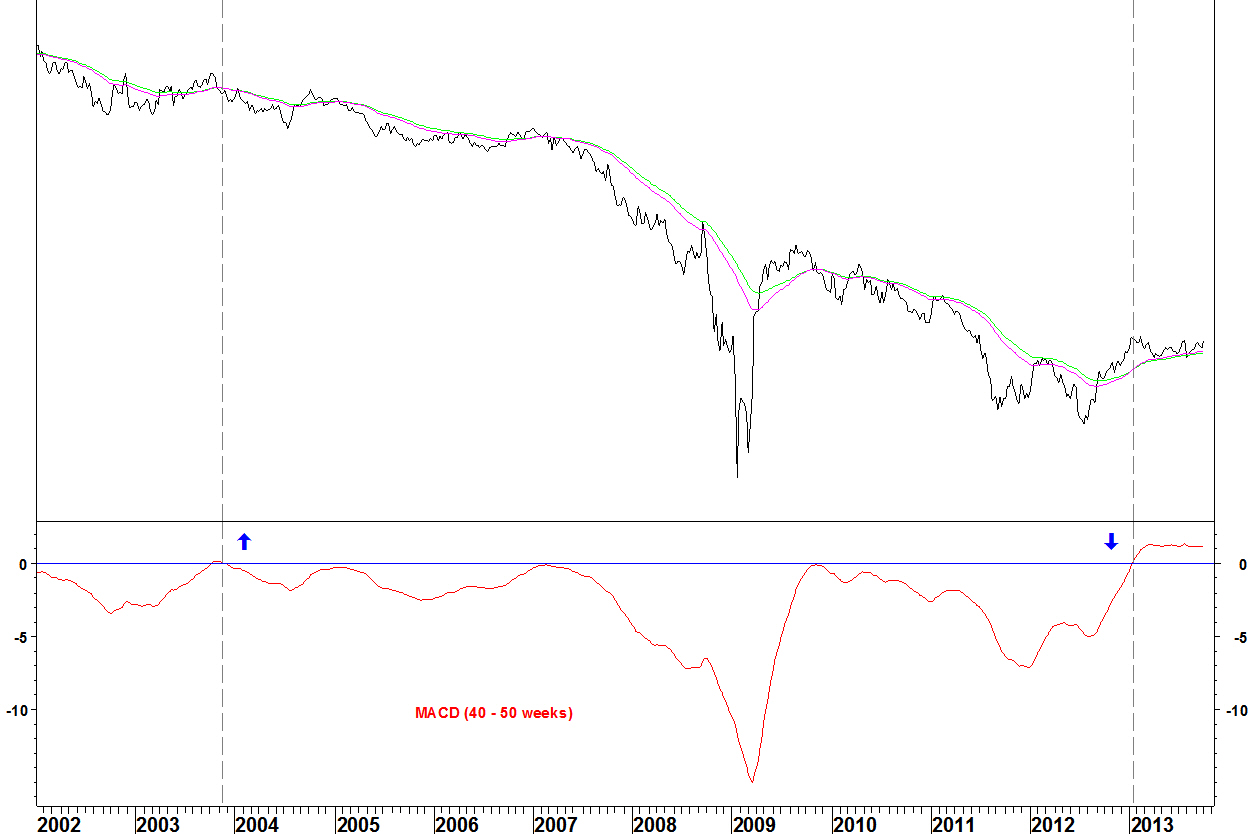
The 40 and 50 week moving averages crossed in January 2013, having not crossed since November 2003
Conclusion
BATS is now set up for a period of underperformance against some other large cap UK stocks, having outperformed for a long time. Moving averages can take a long time to take effect though and we should use other methods like Bollinger Band breakouts to determine the timing of this long term rotation.
The pair position in PPG Industries v SPDR Materials (XLB) was stopped out by Friday’s close. The position lost 3.9%.

Most good trades work quickly after putting them on and this never sustained any of its breaks lower. The examples that work well pick out major turning points, giving moves of 15% to 20%. At least the loss of 3.9% is small compared with this.
The other trades using my Performance Ranking method have not made a decisive move either way yet.
iShares Real Estate (IYR) versus iShares Broker Dealers (IAI)
The pair position in IYR versus IAI as defined last week was triggered by Friday’s close of the RSI above the intervening high.
The position is opened with IYR/IAI = 1.97886. The stop loss is below the 05 September low, which is 3.3% lower, quite a tight stop.
Weekly chart
Agnico Eagle Mines v S&P 500 Index
The remaining half of this is going to be closed. The pair rallied strongly on 18 September but gave up all of its gains over the next two days. This position has reached the stage of hope and so it is best closed. As I write, AEM is at $27.15 and the S&P 500 Index is at 1,699.6.
The total loss on the trade (two halves) is 9.3%. There was a 15.2% gain on the outright position in the Philadelphia Gold & Silver Index, opened on 19 July.
Daily chart
Other trades
The Performance Ranking trades that have been entered [PPG, OI and IFF, all short against their sector ETF SPDR Materials (XLB) ] all develop unspectacularly so far. The Performance Ranking trades within the S&P 100 Index have not been triggered.
Yesterday there was a sharp rally in long dated bonds. This article claimed it was a surprise and maybe it was, but these sorts of moves are more likely when charts are set up to suit them.
The US 10 Year T Note Yield has been setting up according to my RSI divergence criteria.
US 10 year yield – weekly
- The 14 week RSI has bearish divergence
- The MACD does not have bearish divergence, which would have been more ideal. There was this more ideal set up in June 2006 and the yield fell until December 2006
US 10 year yield – daily

The 14 day RSI continues to have divergence and on 05 September, RSI was below 70, setting up according to my daily RSI criteria
My sell signal is a weekly close of the RSI below the intervening low. That looks likely at present. That low is 64.25 from 19 July (blue arrow).
The last divergence set up we had was picked out the September 2011 low. This was also not supported by a MACD divergence and only a short term rally ensued. So this may or may not mark a long term yield peak (hardly likely when you consider how much yields have fallen over 30 years) but what makes it more interesting is the financial sector rotation that comes with it.
iShares Real Estate (IYR) versus iShares Broker Dealers (IAI)
This is a rotation that should be helped by lower bond yields.
Weekly chart

- There is RSI divergence across the troughs against the February 2013 low and within the current trough
- This week, the RSI moves above the intervening RSI high from 19 July (blue arrow) and a close above that high is a buy signal according to my RSI divergence criteria
- Again, the absolute ideal scenario of MACD divergence does not exist, just as in March, when there was a five week rally
Daily chart
- The low was formed on 05 September with RSI above 30
- Coming after previous divergences with RSI below 30, this conforms to my RSI divergence criteria (in conjunction with the weekly RSI status)
- Also, there is daily MACD divergence
Pair trade
- A long position in IYR against IAI will be opened on an end of week close for the RSI above the intervening high
- The stop loss will be below the 05 September low
On 02 September, I showed the bullish daily divergence on the SPDR Dow Jones Industrial Average (DIA). I took half the profit as of the close of 30 August (blue arrow) and moved the stop loss to break even.
That stop loss has now been hit, so the 3.6% profit at the time becomes a 1.8% profit.
SPDR Dow Jones Industrial Average (DIA)
Agnico Eagle Mines (AEM) v S&P 500 Index
With my model portfolio, I show performance by %age gained and don’t include a position sizing. That could help when positions in things that move a larger percentage go against me!
Exact position sizing isn’t really the point of the blog, which is to showcase my identification of trade set ups. I have at times taken half and stop to break even (like above) and last week, I halved the size of the position in AEM v SPX.
That locks in a loss of 3.9% on the closed half of the position. The total loss is currently 9.4%.
The position still has a chance of working, having not negated its bullish weekly RSI divergence. It has to hold above the 06 August low (blue arrow).
Agnico Eagle Mines (AEM) v S&P 500 Index
Other trade set ups
- The trade set ups shown from the S&P 100 Index on 02 September have not triggered yet
- The materials sector pair positions develop unremarkably
