I heard recently that most of the recent gains in the SPDR Consumer Discretionary (XLY) came from just six stocks. That prompted a look at the breadth readings for the ETF.
SPDR Consumer Discretionary (XLY) and % above 200 day moving average

The chart shows some previous divergences that have led to turning points. Note that divergences don’t give the timing of the turn.
A divergence has been building since 2013 but since February 2015, this has become much more pronounced, making it worth greater attention.
In late February 2015, there were 84% of XLY components above their 200 day moving average. In fact, that had blown away the shorter term breadth divergence at the time. Now, only 47% of components are above their 200 day moving average.
Conclusions
The breadth divergence makes the sector more vulnerable to a set-back
As this sector has been one of the few holding the market indices up, this makes those indices more vulnerable
Periods during which divergences build are better for pairs trading within the sector, as there are more opportunities to spot diverging performance
Since 25 August, the S&P 500 Index has rallied 8.9%. There has been a sector rotation away from cyclical stocks towards staples stocks, a negative development for market indices.
In June, I showed the momentum divergence on the outperformance of the iShares Consumer Services (IYC) against the S&P 500 Index.
IYC vs. SPX weekly

- Another divergence of second degree has formed and so far, the monthly RSI is back below 70
- The MACD divergence remains in place (just)
IYC vs. SPX weekly

There was weekly RSI and MACD divergence at the high
IYC vs. SPX daily

- There was a daily RSI divergence below 70 at the high, following a divergence above 70 in early August
- Only this last high matches my RSI divergence criteria, set out on the My methods page
- The relative peaked on 23 September, whilst the S&P 500 made a low on 28 September. The relative has declined during a rising market
Comparison with iShares Consumer Goods (IYK)
IYK is a more defensive ETF than IYC, being heavy on consumer staples stocks whereas IYC has more discretionary stocks.
IYK versus IYC
- IYK has rallied 10.8% since 25 August, outperforming the S&P 500 Index, so the rally has been led by defensive stocks
- The ratio made a spike high on 24 August, coinciding with the sharp index decline
- The ratio has a track record of peaking a few months before the end of bear markets (August 2002 and November 2008)
- The ratio has broken above the base and is above the 24 August peak
Conclusions
- The trend of outperformance by IYC is over and this is a bearish development for the market indices
- Funds should be overweight consumer staples stocks from IYK in the medium term
In addition to tonight’s post, I should also mention that I passed the CFA Level One exam in June! Here were my thoughts on it shortly after, so I surprised myself.
The August decline only lasted three days but in the three weeks since, market indices have moved sideways in a narrow range. That is unlikely to be the end of it.
In June, I showed some long term developments for the market, including the advance decline line non confirmation. Here I show some long term moving average crossovers that are developing or have already occurred. Looking for crossovers on moving averages that have not crossed for over four years is one of the methods described on the My methods page.
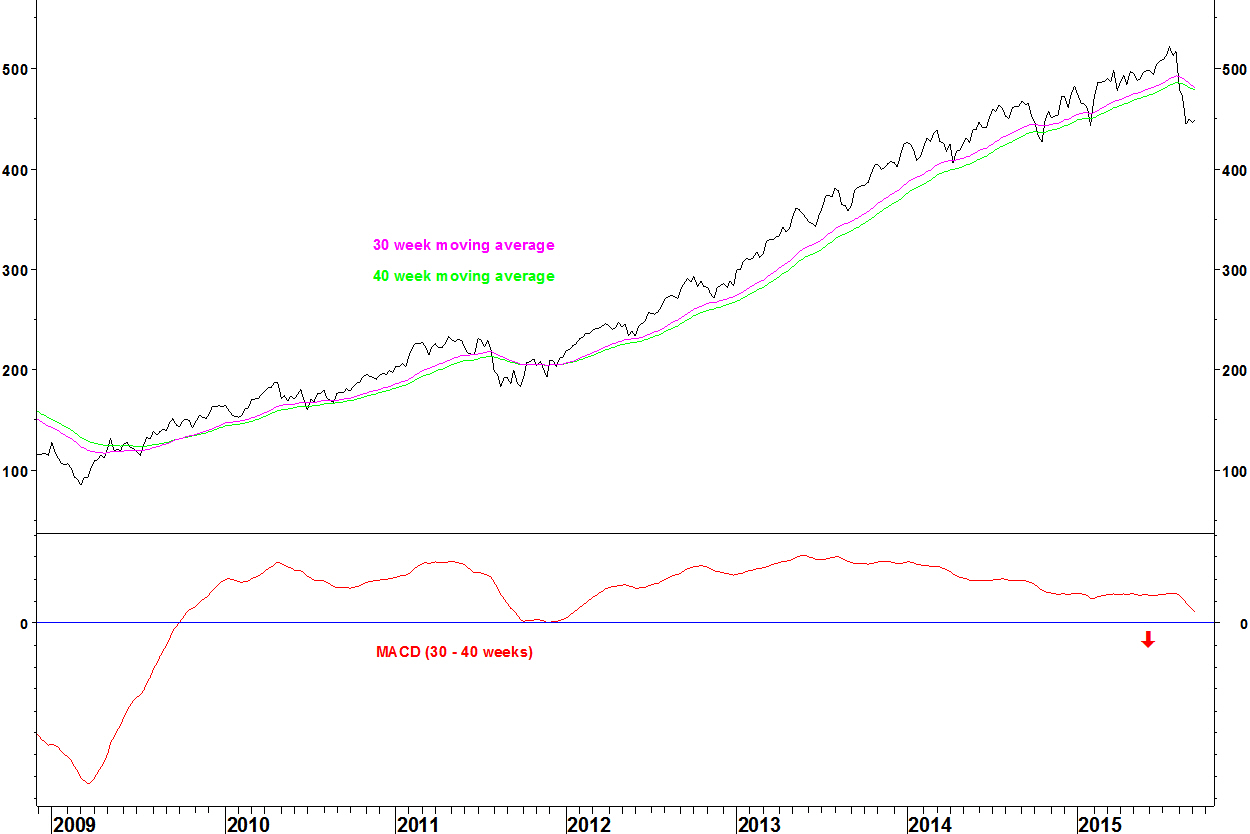
S&P500 Household Products Index

The 30 and 40 week moving averages (exponential) crossed in late May, having crossed up in late 2009. The index then turned down from these averages in mid July.
S&P500 Beverages Index

A marginal new weekly closing high was made in early August but the MACD had weakened. This index is less volatile than the S&P500 Index.
S&P500 Consumer Finance Index

The moving averages crossed in April after four and a half years in positive alignment.
S&P500 Media Index
The moving averages have not yet crossed but MACD divergence has been building since 2013 and we should soon see the first crossover for five years.
S&P500 Road and Rail Index

The moving averages have already crossed for the first time since September 2009. Notes that you don’t always get a nice MACD divergence.
Today I close my SPDR Health (XLV) versus CBS trade. The closing prices are:
XLV: $76.96
CBS: $53.98
Closing ratio value: 1.425713
Gain on trade: 4.8%
The health ETF shows show bearish divergence on its relative versus the S&P 500 and CBS is relative oversold, as witnessed by it holding up on today’s setback.
This might go further in the longer term but I have decided against sitting through pull backs and having just started a new job, I shouldn’t trade with distractions.
A few weeks ago, I showed that CBS had topped against health and staples stocks and that these defensive stocks were poised to break higher against CBS. Today I open a trade in one of these pairs.
SPDR Health (XLV) versus CBS

- Having underperformed CBS for years, the long term moving average turned up in summer 2014
- Since November 2014, the pair has consolidated those gains and the 40 week Bollinger Bands have contracted
- The pair has now broken above the upper band and the band width has expanded
Daily chart

- The trade is opened at a value of 1.3606 as of 8pm UK time today
- The stop loss is at 1.19, below the late May/ early June lows
- The position is opened in my model portfolio
The stop loss is quite wide, as it the way on these breakout trades
Today I reviewed some Bollinger Band breakouts that I noted over the last year. I saw that they don’t always take off in a straight line and that it can be difficult to judge when they won’t work.
One thing going for this trade (or asset allocation for long only managers) is that the wider market appears vulnerable from a breadth perspective, as shown on 15 June. A falling market should help this trade.
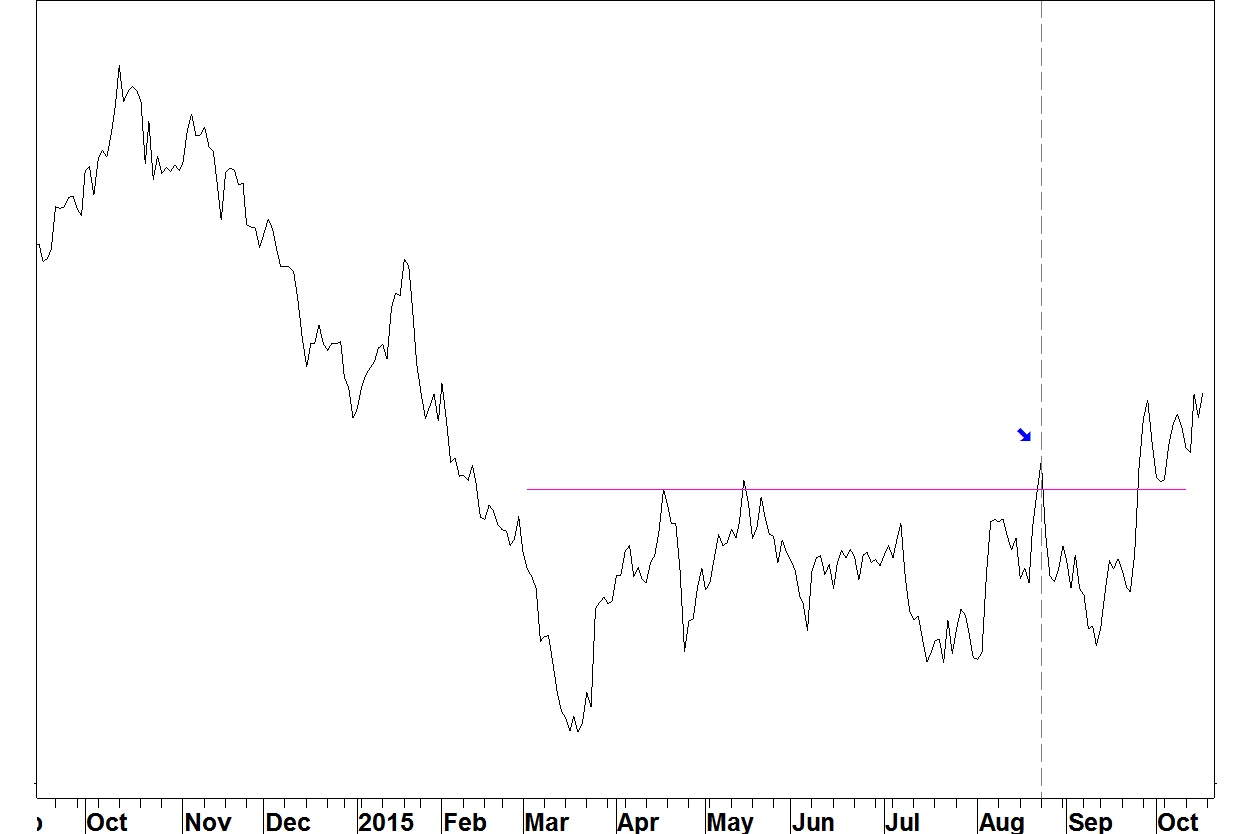
A defensive rotation taking place is improving relative strength for AT&T (US: T).
AT&T versus S&P 100 Index

- AT&T underperformed from August 2012 (red arrow) to April this year
- A bullish divergence on the 14 week RSI was formed in December 2014. The April 2015 low had RSI above 30
- The Performance Ranking (PR) within the S&P 100 Index stocks has rallied to 35 out of 100, the highest since May 2013
Trading tactics
AT&T is overbought against a range of pair candidates on the daily chart. Wait for this to unwind over the next week or two, then buy this pair for a medium term trade.
If you are allocating long only money and concerned by this morning’s gap down, you could be excused for increasing your AT&T weighting now, just be prepared for a little pull back on relative.
I’ve kept an eye on markets whilst studying for the CFA exam but for the first time today, I was able to look at lots of charts. Here are some things that I saw. These fit the set ups defined on my methods page.
1) NYSE breadth divergence
The broad market data breadth indicators were introduced in this post. Now, there is a short term divergence between the new high in mid May of the NYSE Composite Index and the cumulative line of daily advancers minus daily decliners.

A divergence existed at the 2007 and 2000 peaks but these spanned far longer: four months in 2007 and two years in 2000. This short term divergence could get worked off but it is worth noting.
2) Momentum divergences on the iShares Consumer Services (IYC)
The iShares Consumer Services (IYC) has outperformed the S&P 500 Index during this bull market. It contains mainly consumer discretionary stocks and normally, those outperform in a bull market.
IYC versus SPX

On the monthly chart, there are now MACD and RSI divergences. The moving averages (not shown) have been in positive alignment since early 2009 when the MACD crossed above zero. Note that the sector rotation happened before the market bottomed.
With those divergences and the long time since a moving average crossover, this chart is vulnerable to reversion.
3) Bad news for CBS
The media sector has outperformed during this bull market but this is starting to change. Using my Bollinger Band method, there are lots of stocks from the health and consumer staples sectors that have based against CBS and consolidated their first move off the low.
These consolidations have tightened the Bollinger Bands to their tightest in three years and the moving averages have turned up. I now look for breaks higher on these pairs. Here is one example.
Cardinal Health (CAH) versus CBS

Try pairing other defensive stocks against CBS and you’ll find similar examples.
I’ve been quiet on the blog over the last few months as I’ve been studying for my CFA Level One exam, which I took on Saturday 6th June.
There is a lot of content and that’s only part one of three. There was as much content as a year of my university course.
Some content was interesting and will be of practical use. This includes:
Time value of money – discounting cash flows
Economics
Equity valuation models
Fixed income: types, how they work and how they are valued
Alternative investments, including hedge funds
Ethics
I will probably never view other content such as inventory accounting ever again.
I’ll probably have to retake the exam in December. Having started the course in February, there wasn’t time to get through all the content. I studied hard but it is human nature to study the parts you are more interested/ better at. Also, you have to make sure you can do those questions. I’ll have to work on the reporting and accounting content in later in the year.
I’d like to find an employer that buys into my strengths, which I show on this blog. However, I’ve been advised that the CFA is worth having so that’s why I’ve started it.
At last week’s high, the percentage of stocks in the NASDAQ 100 Index above their 50 day moving average showed a bearish divergence against the highs of late 2014. There was also a small divergence within the latest peak
NASDAQ 100 Index and 50 day moving average breadth
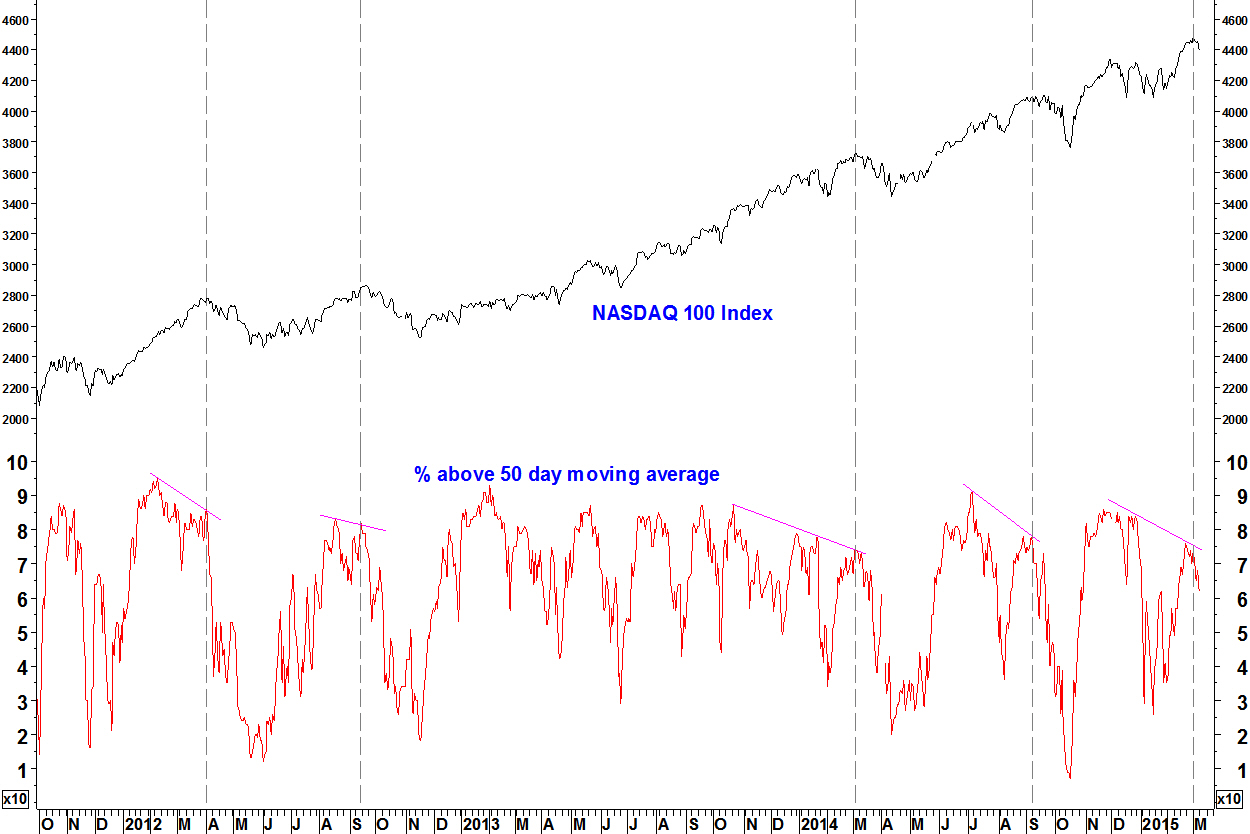
- There have been four peaks marked by bearish divergences on this indicator since the start of 2012
- Not every divergence marks a peak but they tell us to be on the look out for other clues as to when a decline will start
- There haven’t been any meaningful peaks on this chart that occurred without a divergence
I have got breadth data on this index, the S&P100, S&P500, mid cap, small cap and Russell 2000 indices. It covers long term breadth (%age above 200 day moving average) and goes down to shorter periods including 50 and 21 day moving average.
It means I can give you comprehensive coverage of breadth indicators on US markets. Also, I can set up breadth indicators on any group of stocks, like a sector ETF. These are powerful tools, they work.
Meanwhile, I’ve got to get back to studying for my CFA exams.
