NASDAQ 100 breadth shows divergence
At last week’s high, the percentage of stocks in the NASDAQ 100 Index above their 50 day moving average showed a bearish divergence against the highs of late 2014. There was also a small divergence within the latest peak
NASDAQ 100 Index and 50 day moving average breadth
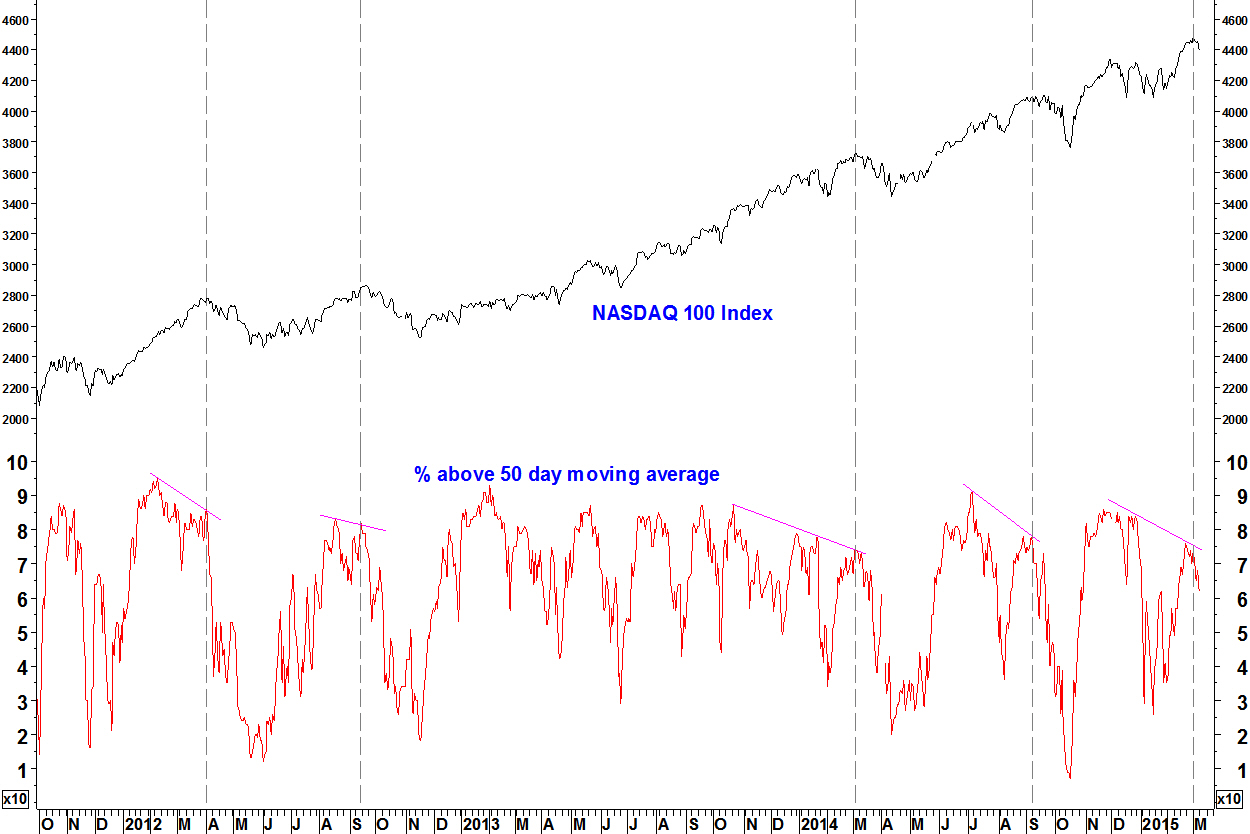
- There have been four peaks marked by bearish divergences on this indicator since the start of 2012
- Not every divergence marks a peak but they tell us to be on the look out for other clues as to when a decline will start
- There haven’t been any meaningful peaks on this chart that occurred without a divergence
I have got breadth data on this index, the S&P100, S&P500, mid cap, small cap and Russell 2000 indices. It covers long term breadth (%age above 200 day moving average) and goes down to shorter periods including 50 and 21 day moving average.
It means I can give you comprehensive coverage of breadth indicators on US markets. Also, I can set up breadth indicators on any group of stocks, like a sector ETF. These are powerful tools, they work.
Meanwhile, I’ve got to get back to studying for my CFA exams.
