28 May
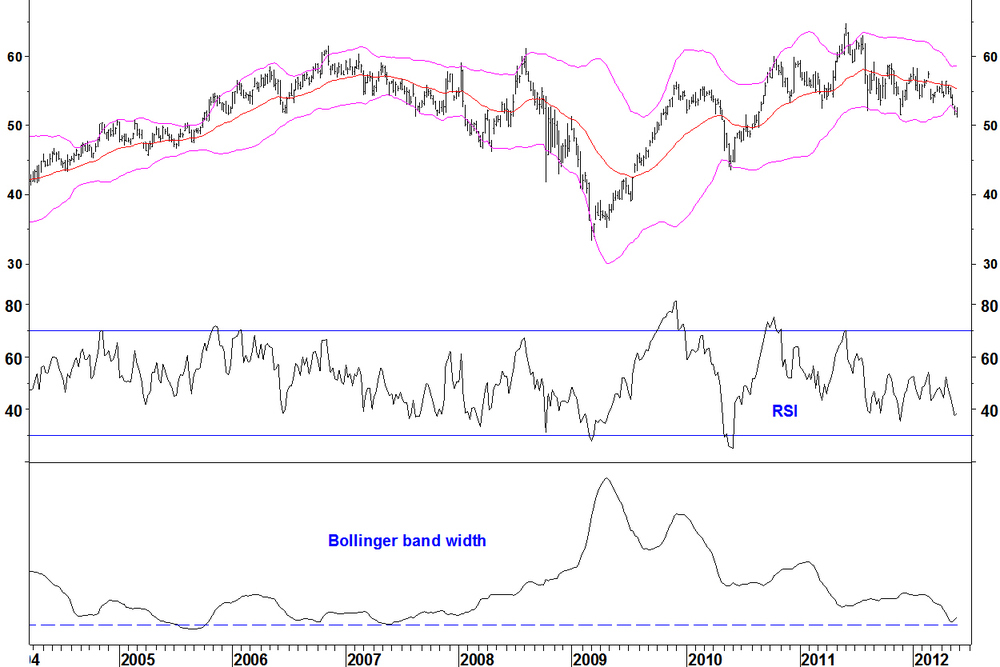
My Bollinger band contraction and breakout method states that bands must be at their most contracted in three years. It gives the entry criteria but it does not define the period of the bands. By default, I use a 40 week exponential moving average and two standard deviations on the bands. Scan results can vary with these parameters significantly, so which parameters are correct? There is no single correct answer, instead, I check for:- The moving average has done a reasonable job of defining the trend and the turns over recent years
- Previous band contractions have done a reasonable job of leading to breakouts
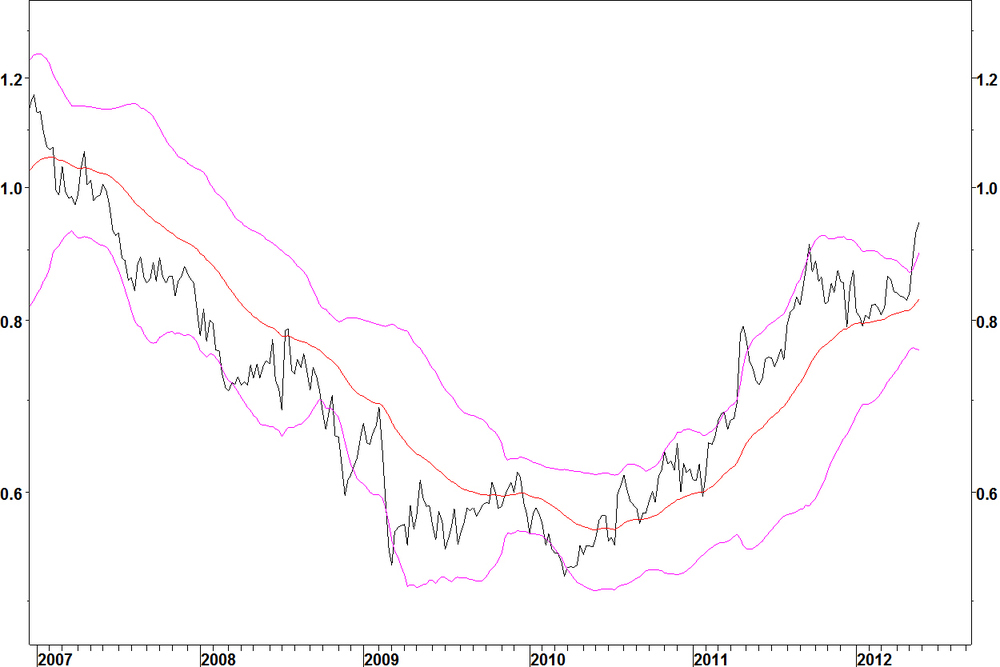
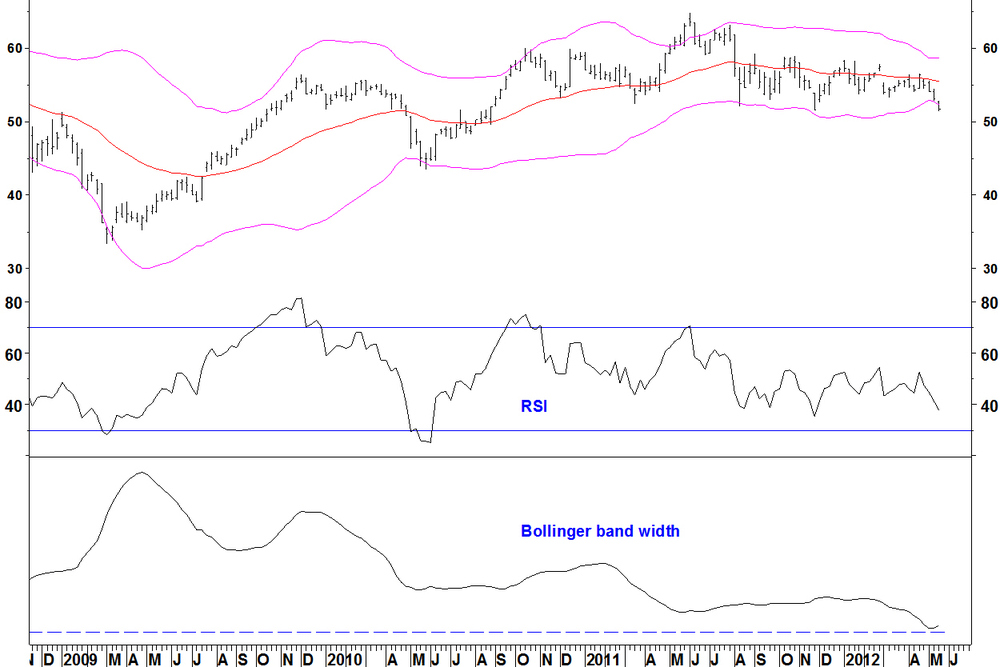
Having looked for band contractions on pairs involving an Indian technology outsourcing stock Patni Computer (PTI), I found from many more positive scan results on 25 week bands than on 40 week bands.
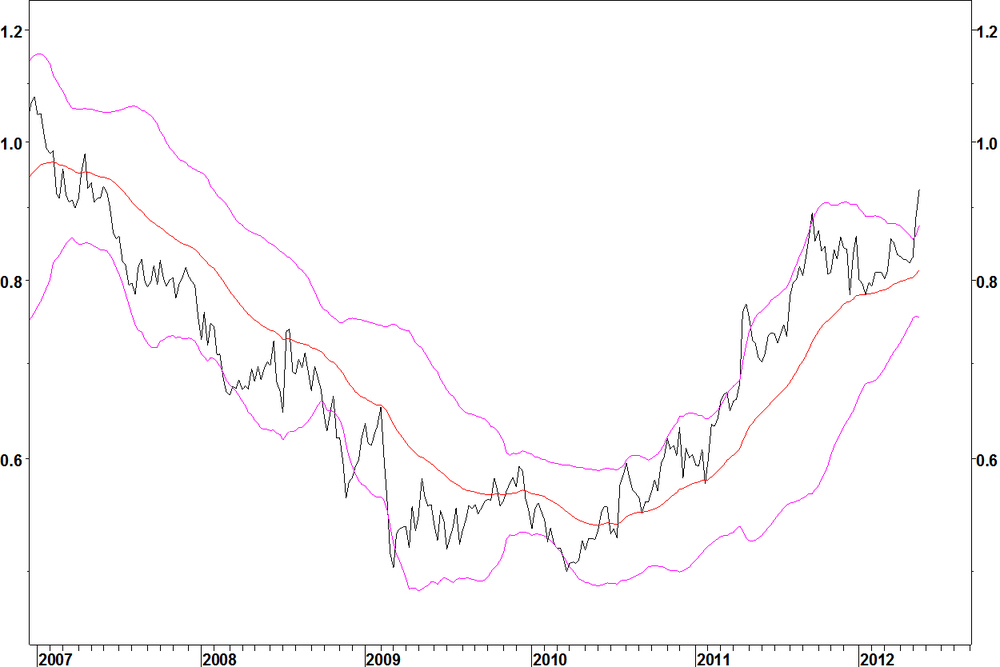
Patni Computer (PTI) v NASDAQ 100 Trust (QQQ)
- The 25 week moving average has defined the trend well, there have been no false turns of the average
- The band contraction in 2007 led to a reversal, although not without a significant pullback into the pattern
- The contraction in 2009 led to a breakout (usually I look for continuation rather than reversal)
- The contraction in 2011 was not particularly tight, so although it didn’t follow through, I would place less weight on this
- Now, the bands are their tightest ever and with the moving average rising, I am looking for a break above the upper band as an entry signal
- By comparison, the 40 week bands are less contracted at key turning points, although the 40 week moving average is still fits reasonably
Conclusion: Buy Patni Computer (PTI) vs. NASDAQ 100 Trust (QQQ) on an end of week close above the 25 period bands, with an expansion of the band width.
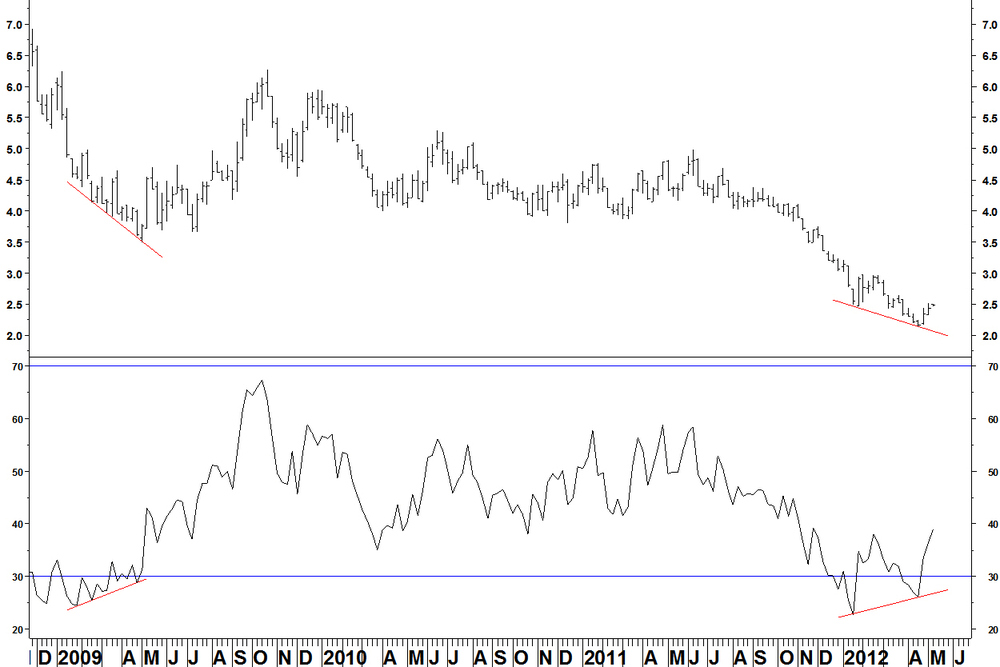
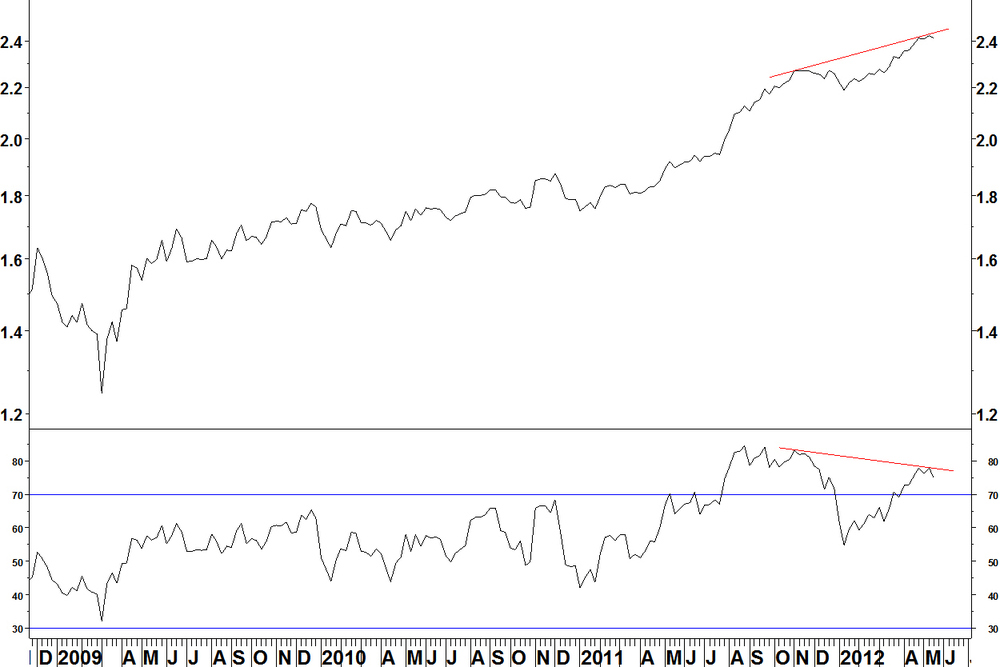
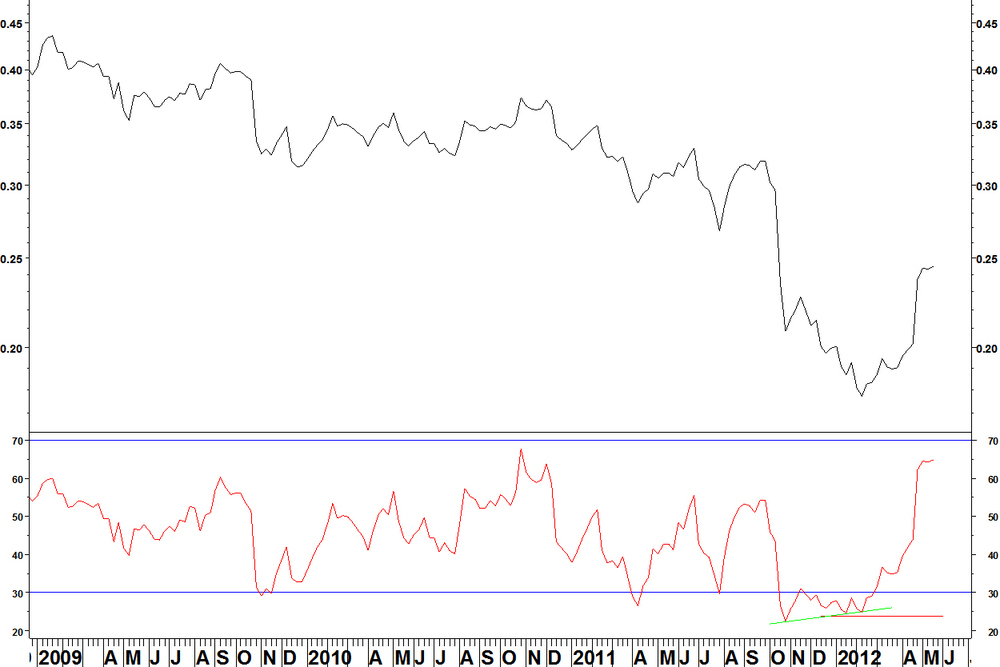
Patni as a RSI divergence example
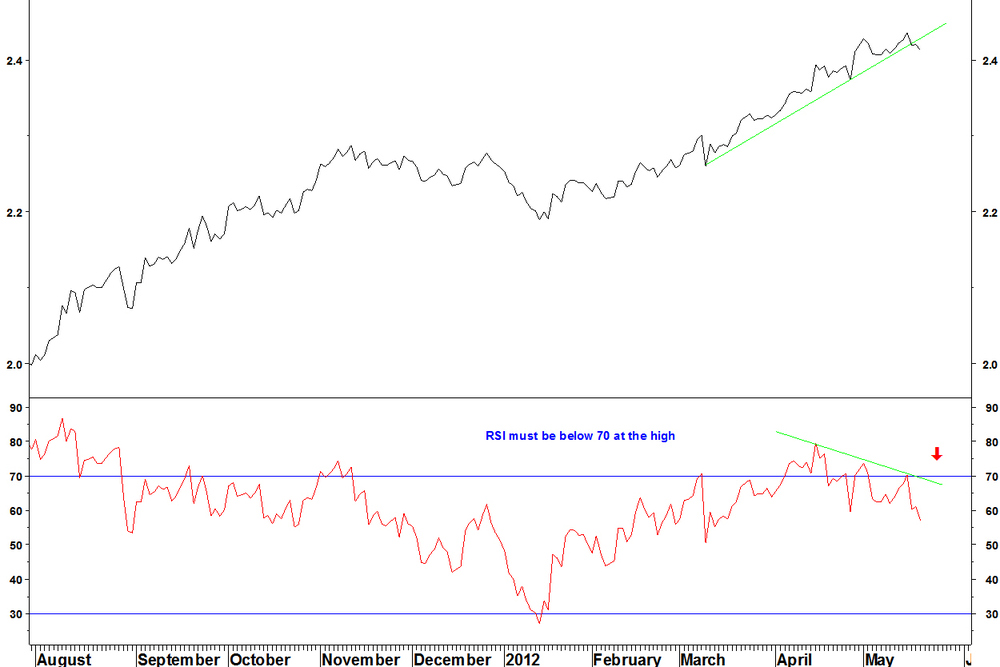
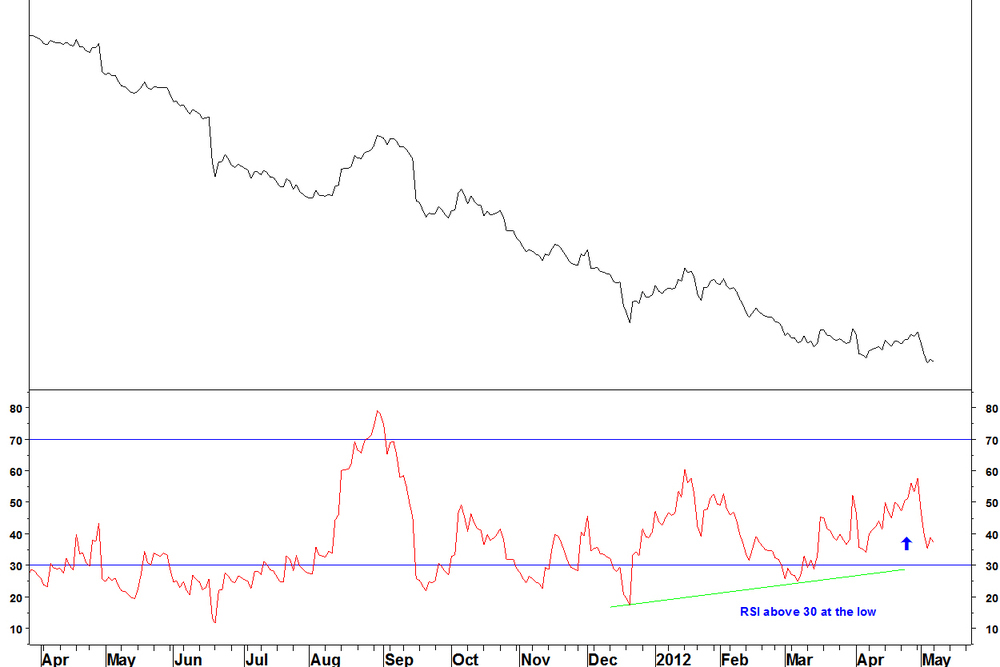
At the 2011 low, there was a weekly RSI divergence. The first divergence did not produce a move above the intervening RSI peak, but the second one did. Daily chart
- The daily RSI at the low was above 30 (meeting my criteria)
- Sometimes you don’t always get a convenient entry point, like a pullback and a higher high
- If the ratio breaks the upper band, that will likely entail a break of resistance since late February
28 May
In my methods section, I show the criteria for RSI divergence trades. I look for weekly rather than daily divergences, as these are rarer, more reliable and can mark long term turning points. Nevertheless, daily divergences are worth paying attention to, more as a reason to take profit (see AEM v XAU earlier today) and as a reason to hold off from entering a position until that divergence unwinds. There are a lot of bullish daily RSI divergences now, which means the market may rally in the short term. iShares Emerging Markets (EEM)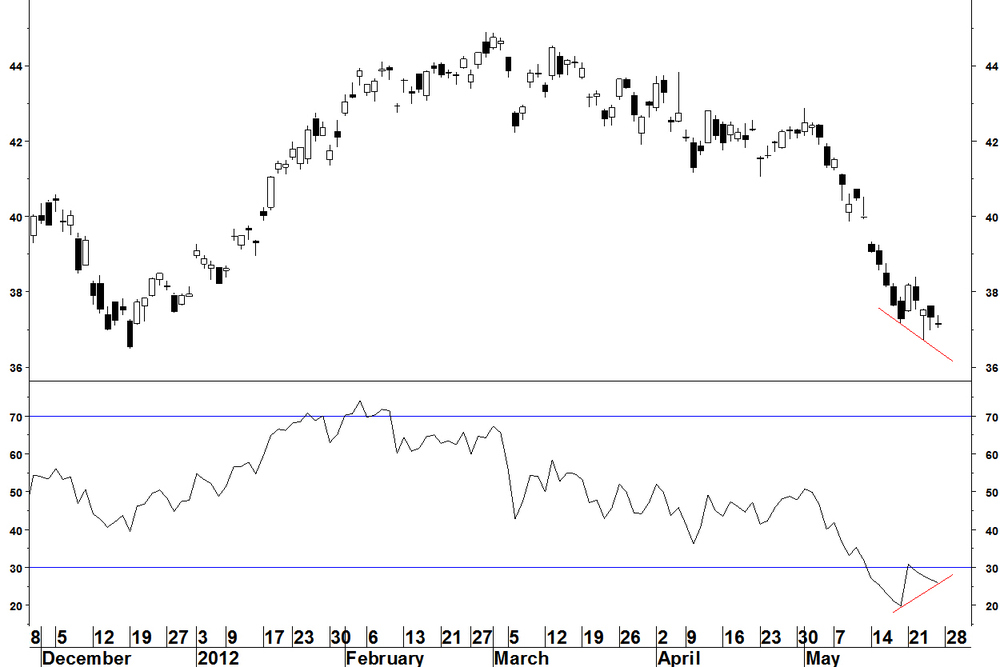
The RSI buy signal is given by the move above the intervening RSI high from 21 May.
Euro v U.S. Dollar
Likewise.
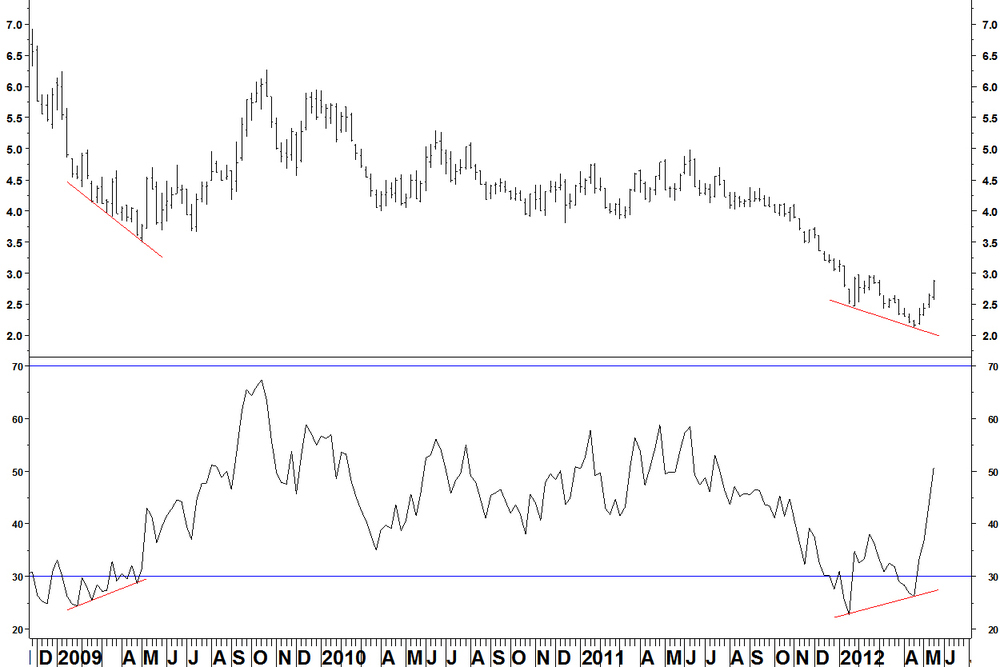
The example below from August 2010 on the same series shows why daily divergences are not good enough for trade entry.
The divergence is formed on 06 August 2010 and the price unwinds from overbought, consolidates for one month and goes higher.
Weekly chart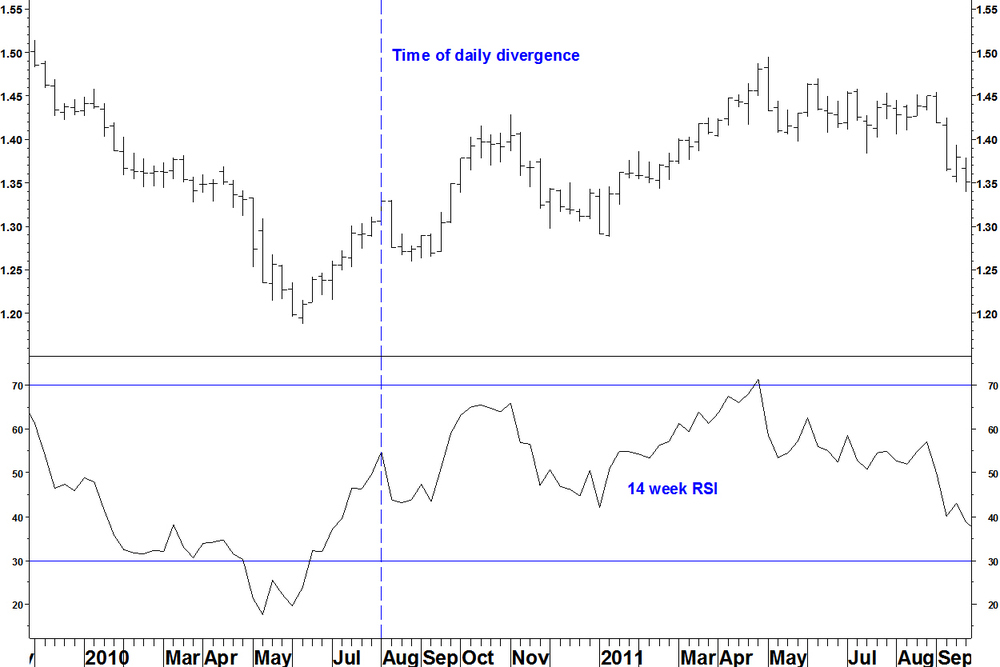
The 14 week RSI was mid range when the daily divergence was formed, leaving plenty of scope to go higher once the short term overbought condition was relieved.
I could show hundreds of these examples, the point is: Weekly RSI divergences are rarer, more reliable and more likely to mark long term turning points than daily divergences.28 May
I’ll show that the current recommendations have made progress but then (in another post), I will show that in the short term, there may be some reversion, i.e. a short term market low that will likely delay the progress of these recommendations. Agnico Eagle Mines (AEM) v Philadelphia Gold & Silver Index (XAU)- This now has a RSI divergence on the daily chart
- You should have taken some profit, now is time to take the rest
- The 14 week RSI is not yet overbought (67) but there is no guarantee it will reach it

The Amex Gold Bugs v S&P 500 Index chart from two weeks ago has begun its reversion towards the moving averages.

Coca-Cola Femsa (KOF) v iShares Mexico (EWW)

- This continued its Bollinger band breakout last week
- The RSI is overbought in the short term, so this may pull back
- You should take some profit now and stop loss to break even on the remainder
- This could continue higher in the medium term
SPDR Health Care (XLV) v Teva Pharmaceuticals (TEVA)
- This has also continued its Bollinger band breakout
- As above, you could take some profit in the short term
Last week, two stocks broke down from Bollinger band contractions on price.
Firstly, U.S. Steel (X) broken lower. However, I’m now not convinced that this breakout will run immediately.
U.S Steel (X) v S&P 500 Index

- This has underperformed for a long time, so much so that the relative strength v S&P 500 Index will form a bullish divergence (below 30) if it falls a bit lower
- The price has fallen from above $60 in February 2011 to just above $20 now. It can go lower but maybe it is too late for this to be the best short position
Novartis (NVS)
- This did not continue to break down from its Bollinger bands
- It still has potential to break lower but given the short term oversold condition, this is unlikely to happen immediately
- I would leave this and revisit in a few weeks, although I don’t want to get too much into calling short term market turns. I’m aiming to show a consistent method of finding medium term trade set ups
The Simon Property Group (SPG) trade shown last week has not yet set up correctly but still could do so.
21 May
Here is an example of an RSI divergence trade on a real estate pair.
These trade types are quite difficult to take on because on another time frame (say a monthly chart) they appear to be going straight up, or, against another ETF, the divergence isn’t set up correctly. Nevertheless, I’ll show the set up, which is almost complete and you can judge it.
The pair is Simon Property Group (SPG) v iShares Real Estate (IYR). SPG is the biggest component of IYR.
Weekly chart
- The weekly chart shows a long term uptrend but an RSI divergence against the 2011 high
- There is also a MACD divergence
Daily chart
- The daily chart shows the 01 May divergence failed to hold the advance
- Another divergence formed on 15 May, still above 70
- The requirement is a new high with a daily RSI divergence below 70. That has yet to form
- If it does form, a formation break can be taken as an entry signal, a break below the last low, with a stop above the high
At the very least, this event could trigger you to rebalance a real estate portfolio back to neutrally weighted in SPG. It might turn into a good pair trade or it could just go sideways for a while and unwind the divergence.
Tell me what you think of these RSI divergence trades. Do you think they are just trying to pick exact tops and bottoms or do you think the entry criteria are specific and important enough to matter? I’ve seen so many important turning points marked in this way but I admit that divergences have potential to continue before they kick in.21 May
Firstly to update the two positions that are running, they made good progress last week. The Coca-Cola Femsa (KOF) v iShares Mexico (EWW) trade was entered last week. It made good progress.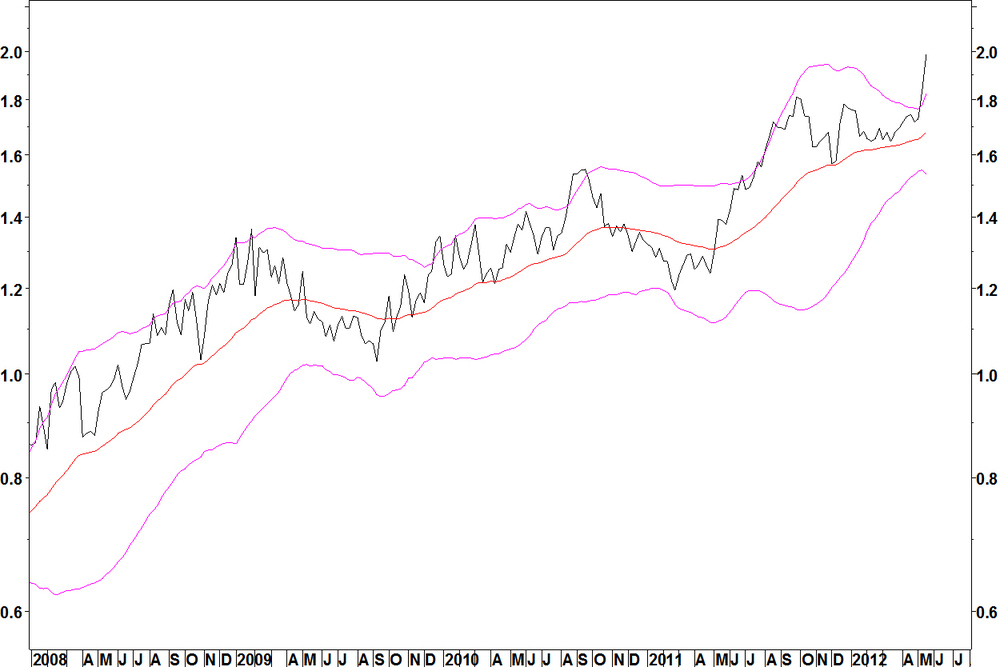
The SPDR Health Care (XLV) v Teva Pharmaceuticals (TEVA) also made good progress last week.
The Agnico Eagle Mines (AEM) v Philadelphia Gold & Silver Index (XAU) trade has made a decent profit and you could low take that profit or run as you see fit. Just because it hasn’t reached weekly overbought yet, doesn’t mean it will.
The bullish RSI divergence on Natural Gas resulted in some upside but none of the stock pairs that I showed with it set up correctly. There is still the chance that some might but that would then be less to do with natural gas and more due to a short term broader commodity stock rebound.
Of the four Bollinger band contractions on price shown last week, two of them triggered at the end of the week.
U.S. Steel (X) broke below its lower band and the band width expanded.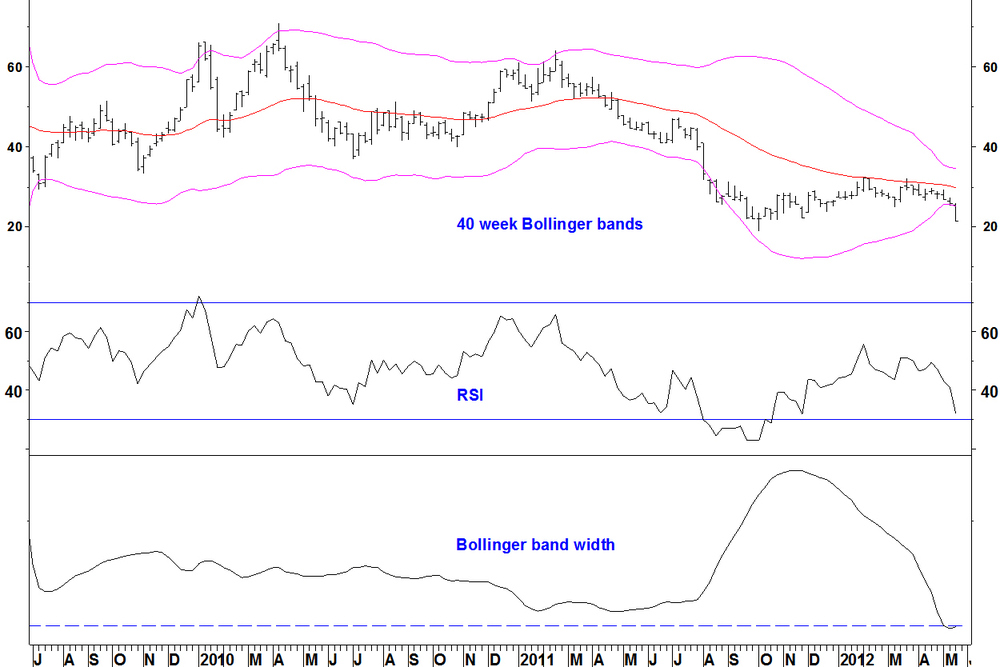
Same is true for Novartis (NVS).
There might be a bit of a market rebound for a few days but I won’t commit too much to calling every market turn. The point is, on a medium term time frame, the entry signals have been given.
14 May (blog 4 – the last one)
So far my Bollinger band contraction examples have been pairs trades. There are more of them to look through and so examples should be easier to find.
Here are some examples of 40 week Bollinger bands on raw price that have:- Contracted to their tightest in three years
- Have an obvious recent tightening, not a dribbling together of the bands
See the methods page for the full outline.
Example 1 – U.S. Steel (X)
- The 40 week Bollinger bands have contracted to their tightest in over 10 years
- Price is still below the falling 40 week moving average
- I am looking for a break below the lower band. The entry signal will be (as always) an end of week close beyond the lower band and an expansion of the band width
- The stop loss will not be particularly tight on this. Even if you got above the 18 April high of $29.54, that will be almost 20% away. Maybe you have it tighter, above the 09 May high of $26.87. That is your call, I’m just showing the set up
It is a while since Bollinger band contractions have been a factor on this chart. This is because the crash widened the bands so much. In the glory days of 2004 – 2007, this stock would resume its uptrend following Bollinger band contractions of a consistent degree.
Example 2 – Covance Inc (CVD)
- This is a health stock, the Bollinger bands are their tightest since Jul 2008
- Price is below the falling 40 week moving average
- Again, look for a break below the lower band to open a short position
- The stop loss is above the high of 02 May of $47.92. The long tail of the following day’s bar looks like a rogue trade
These two examples have made little progress since the index lows of last autumn, so they might struggle in a neutral or down market. The flip side is that they might not be the worst stocks in the market. They might get some relative strength reversion but this is an absolute not relative trade.
Example 3 – Novartis AG (NVS)
- This stock is a.. alright, you know what this is
- The bands are the tightest since May 2007
- The moving average has turned down
- The bands are now visibly pinching rather than dribbling together
- The price has done nothing in the index rally since last autumn
Being in a defensive sector, this might not be the best performer as a short but it meets the criteria for tight bands, so wait for the entry signal of a close beyond the band and a band width expansion
Example 4 – CSX Corp (CSX)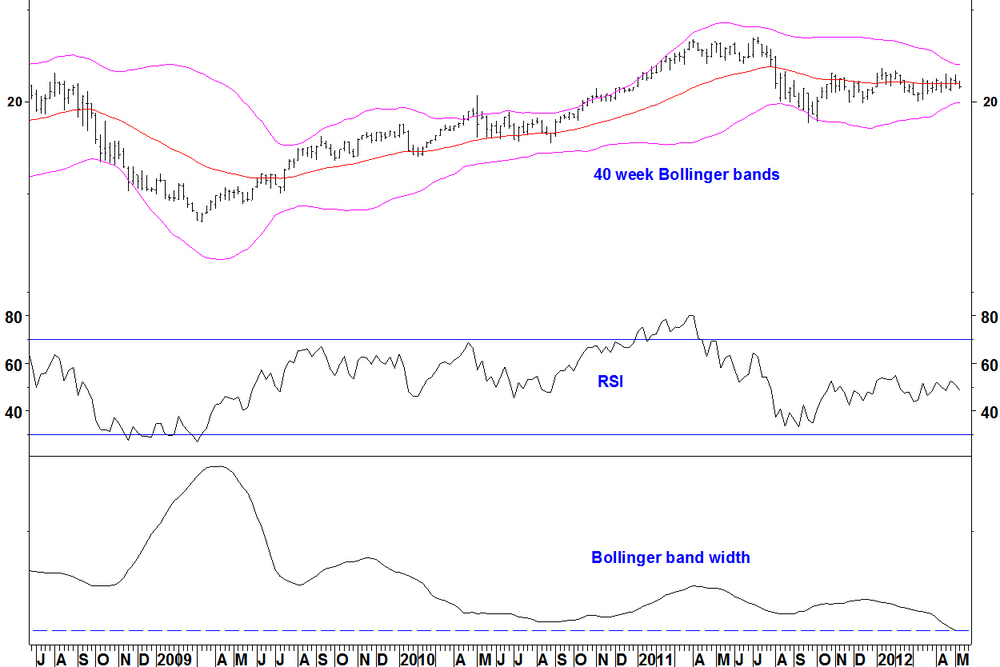
This stock is a rail container operator and the 40 week bands are the tightest since October 2004.The moving average is flat, a disadvantage over the first two examples, as far as taking a short trade anyway. I’m showing it as it has hardly participated in the market rally since October 2011 and this might be a consolidation before continuing lower.
Rare trades
The above situations are rare. I scanned 592 stocks and indices, got 25 results and picked the best four. Scan results are a good start but they always need the human eye.
14 May (blog 3)
Here is another example of a Bollinger band breakout trade, similar to the Mexican pair that I updated earlier today.
This is a health sector pair: long SPDR Health Care (XLV), short Teva Pharmaceuticals (TEVA), an Israeli company with an ADR.
XLV versus TEVA weekly

- After a long term downtrend, the ratio based in 2009 and 2010
- The ratio has consolidated since September 2011, allowing the Bollinger bands to contract to their tightest for years (tightest in three years is the criterion)
- Last week, the ratio broke above the upper band and the band width expanded
- The breakout is in the direction of the moving average, something I am looking for now for these trades
Daily chart

- The ratio is overbought in the short term but that is what happens with volatility breakouts
- The ratio may or may not pull back in the short term, that isn’t the point. The point is, this is set up to continue higher in the medium term
- The stop loss is below the mid April low (red arrow)
14 May (blog 2)
The relative strength of the Amex Golf Bugs Index (HUI) against the S&P 500 Index has been in a long term uptrend. For many years, the moving averages have been in the same alignment (short above long and rising) but now this is changing.
I limit my use of moving averages to picking out long term changes shown by moving average crossovers. As this example will show though, these are not particularly a timing tool, they just tell you that a long term trend has changed.
Amex Gold Bugs Index (HUI) vs S&P 500 Index (monthly chart)
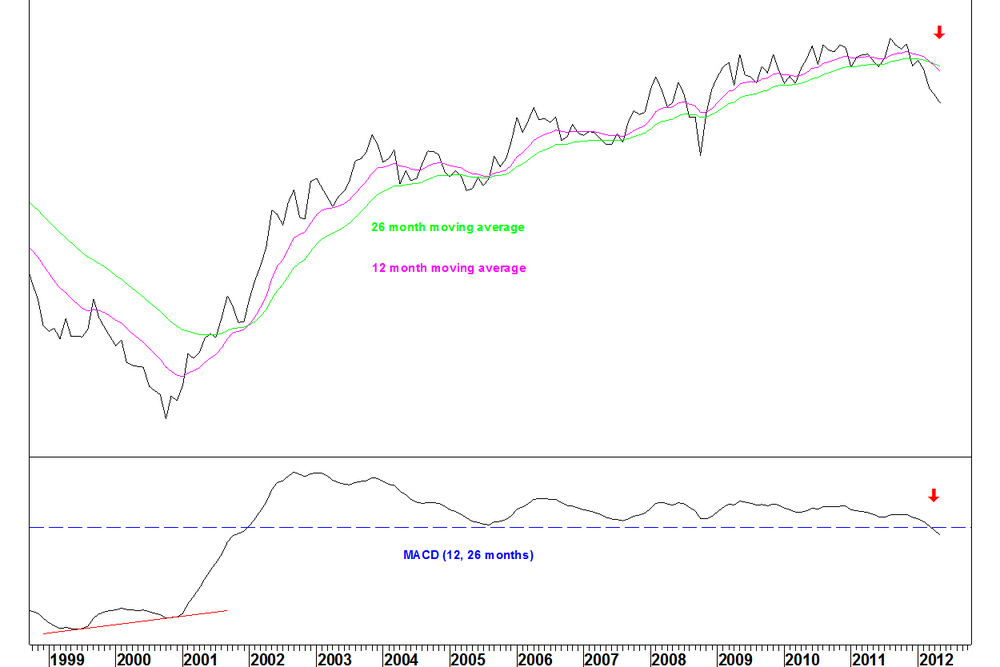
- Following 10 years of the 12 month average being above the 26 month average, there was a moving average crossover in April
- Another way of showing this is that the MACD indicator crossed below zero
- There were multiple bearish divergences on the MACD indicator, through most of the last 10 years but you have to wait for the crossover rather than try to guess which divergence will work
- Note there was bullish divergence on the MACD at the 2000 low, same on the RSI (not shown)
All this does is tell us that something has changed. The relative strength had to fall a long way to give this signal. It not a timing tool.
Weekly chart

- The relative strength line has almost halved since its September 2011 peak
- The 14 week RSI is oversold and although the RSI divergence criteria are not yet met, there could easily be a recovery soon.
- There is no guarantee that any recovery will stop at the moving averages
- Given that the moving averages were aligned one way for so long, now they have crossed this represents a change, so we cannot expect a recovery to be sustained
- More likely, a recovery would just be an unwinding from oversold before the downtrend resumes
14 May
On 16 April, I presented a trade set up on a Mexican stock pair, which you can see here. The pair was Coca-Cola FEMSA (KOF) versus iShares Mexico (EWW) and was an example of my Bollinger band breakout method.
The entry criteria were an end of week close above the upper band, with the band width starting to expand and these have now been met.

The ratio was consolidating above a rising moving average, so expectation was for continuation higher. With KOF being a consumer staples stock (defensive), the ratio will tend to rally when the market is falling, or at least not rising strongly.
You could run this trade now with a stop loss below the mid February low. That low is 9.4% lower as of Friday’s close.
08 May
A couple of problems. Firstly, the pair of Sara Lee (SLE) v Archer Daniels Midland (ADM) had started off well but there was a big up day for ADM last week, moving it to a 2012 high against the S&P 500 Index.I would cut this pair now but the SLE part remains an outperformer of the S&P 500 Index.
ADM v SPX

Secondly, the Research in Motion (RIMM) v NASDAQ 100 (NDX) made a new low and I have said on Twitter to stop this out.
RIMM v NDX
It may be that I have to introduce a formation break element to the RSI divergence trades, as in forming a higher high on a short term chart. That might make the RIMM trade one to come back to and this is the difference between it and the Agnico Eagle (AEM) v XAU trade, which now has a 27% gain! You should have taken at least some profit last week and now run it as you see fit.
Reviewing trades As long as you review each trade, try to identify what was wrong and cut it out next time, you’ll make progress. I have spent a long time identifying the set ups that I have described. They are correct but they still may require fine tuning through some tighter rules. Upcoming trades The Coca-Cola Femsa (KOF) v iShares Mexico (EWW) set up continues to develop favourably. I’m looking for an end of week move beyond the Bollinger bands for a buy signal. With today’s move for the pair, that may come this week.KOF v EWW

Natural Gas rallied from its bullish RSI divergence but none of the stock pairs I’m watching have set up correctly yet.